Importing Data and Drawing a PLS-SEM Model in SmartPLS 4
Import a CSV file into SmartPLS 4 with the missing value marker -99, draw the constructs and paths, then check the model with one PLS-SEM run


Key takeaways
SmartPLS reads CSV, TXT, SPSS and Excel files, but the Student license accepts only CSV files of at most 100 rows.
Declare the missing value marker (-99) in the import dialog; otherwise SmartPLS treats -99 as a real answer.
Drag a group of items onto the canvas and name the construct; connect the seven paths with the Connect tool.
One run of the PLS-SEM algorithm matches cSEM to the third decimal (H1 = 0.501, R² of intention = 0.318).
Casewise deletion keeps 254 of 267 respondents; report the number of observations actually used.
Post 32, "How to Install SmartPLS 4 and Find Your Way Around the Interface" created the project Marketplace X and introduced the interface. This post brings the Marketplace X data into the project, draws the five constructs with their 20 items, connects the seven paths H1 to H7 as in Post 26, "Structural Equation Model (SEM) in JASP" and then runs the PLS-SEM algorithm once to make sure the model is drawn correctly. Evaluating the results starts in Post 34, "Evaluating the Reflective Measurement Model in SmartPLS 4".
Sample data and scripts. The data files and scripts for this post are in the research-data-analysis repository on GitHub (folder
data/andscripts/). Download the whole repository with Code > Download ZIP.
About the screenshots and numbers. All figures are real screenshots of SmartPLS 4.1.2.1 (Ringle et al., 2026) on macOS (Apple silicon Mac). Most were taken in November 2026 with the 30-day trial, which has all features of the Professional license (Post 32). Figures 1 and 3 were taken on 6 November 2026 with the Student license; Figure 11 and the left half of Figure 13 also date from 6 November 2026 and were taken with the trial. Because the Student license does not accept data with more than 100 rows (Section 1), the screens that only appear with the Student license (the SPSS import attempt and the not licensed data file) are described in words. The numbers were cross-checked with the R package cSEM 0.7.1 (Rademaker & Schuberth, 2026), script
compare_pls.R.
1. Prepare the data file
SmartPLS 4 reads four file types: CSV, TXT (tab-delimited), SPSS (.sav) and Excel (.xls, .xlsx). The first row of the file is used as the variable names (SmartPLS GmbH, n.d.-a). Check three requirements before importing:
One delimiter and one decimal separator throughout the file, with no empty or extra columns (SmartPLS GmbH, n.d.-e).
One convention for missing values: leave the cell empty, or write a code that cannot occur in the data, for example -99 (SmartPLS GmbH, n.d.-b).
A suitable license: the Student license imports only CSV files and at most 100 rows of data; the trial and the Professional license have no such limit (SmartPLS GmbH, n.d.-d).
The Marketplace X data set used in the AMOS posts (marketplace_x_sem.sav) has 267 respondents. Across the 20 items there are 21 blank cells, spread over 13 respondents (0.39% of the cells); the item with the most blanks is CONF3 with 3 cells, that is, 1.12%. So that the file works with both the Student license and the full versions, this post converts it to CSV with the script make_smartpls_csv.R. The script only changes the format: comma as delimiter, decimal point, blank cells written as -99. No other value is changed. The result is the file marketplace_x_smartpls.csv with 267 rows and 26 columns: the 20 items, the demographic variables and the column N_MISSING (the number of blank items of each respondent).
2. Import the data into the project
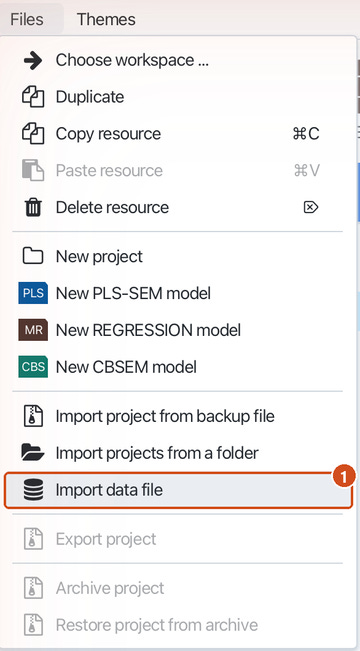
Step 1. Select the project Marketplace X in the Workspace pane, then choose Files > Import data file (Figure 1). You can also click the Import data file link right below the project name.
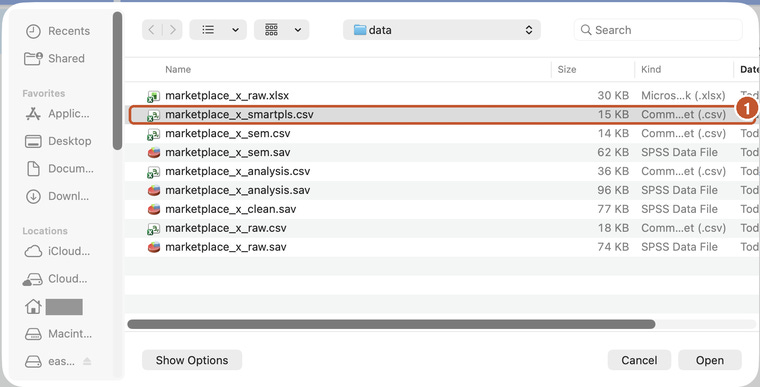
Step 2. In the file dialog, go to the folder that holds the data, select marketplace_x_smartpls.csv and click Open (Figure 2).
Importing an SPSS file with the Student license. In an earlier test, importing the .sav version of the same data with the Student license was tried. SmartPLS still opened the SPSS import dialog and read the data correctly: 267 respondents, 22 missing values and the number of blank cells per item matched the original file (CONF1 2 blanks, CONF3 3 blanks). A .sav file marks its own missing values, so no code needs to be declared. But when Import was clicked, SmartPLS showed Feature locked (Figure 3): the Student license cannot import SPSS files. From the next attempt on, .sav files were grayed out in the file dialog. With the Student license, use the CSV file.

Step 3. The CSV import dialog opens (Figure 4). Check the four settings in the second row: Delimiter character is Comma, Escape character is None, Locale is US (example: 1,000.23) (a decimal point) and Encoding is UTF-8.
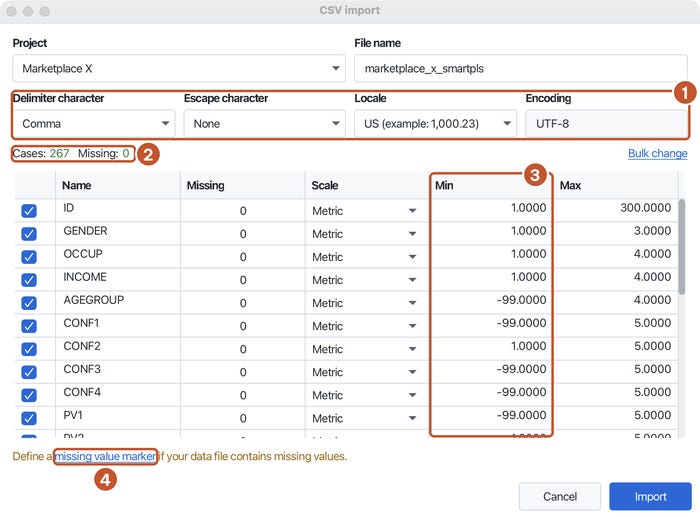
Look closely at Figure 4: the top line reads Missing: 0, and the Min column shows -99 for AGEGROUP, CONF1, CONF3, CONF4 and PV1. SmartPLS treats -99 as a real answer. If you click Import now, the -99 values enter the calculations and distort every result. This is the easiest mistake to make when importing data.
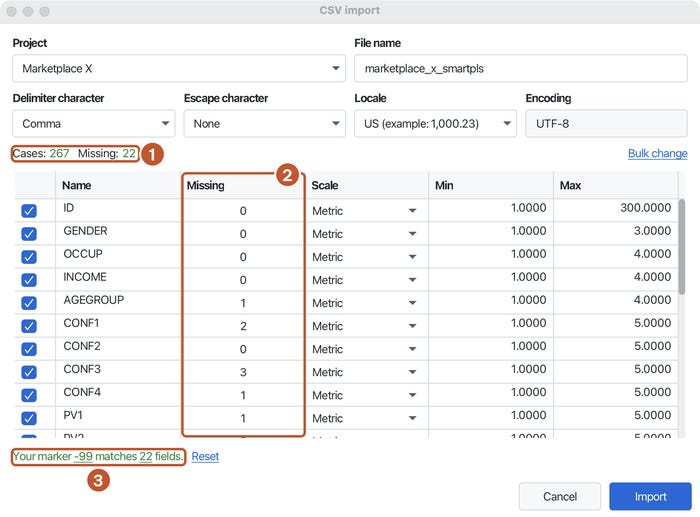
Step 4. Click the missing value marker link at the bottom of the dialog. Type -99 in the Missing box, then click Apply (Figure 5).

Step 5. Check the dialog again (Figure 6). The top line must read Missing: 22, the Missing column shows the number of blank cells of each variable, the Min column is back to 1 and the bottom of the dialog reads Your marker -99 matches 22 fields. The 22 consists of 21 cells in the items and 1 cell in AGEGROUP. Click Import.
3. Read the data view
After the import, SmartPLS opens the data view (Figure 7).
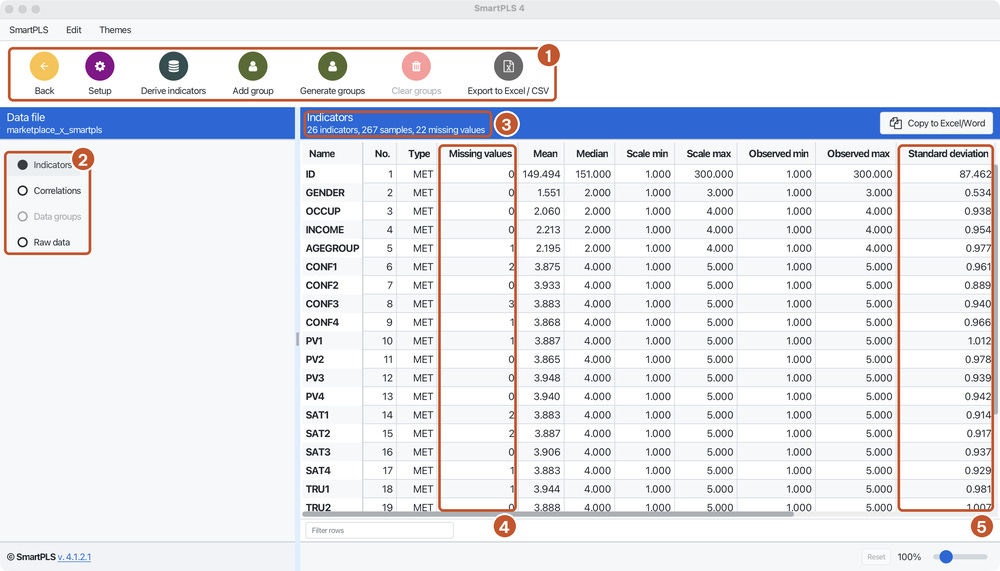
Toolbar: Back (return to the project), Setup (reopen the import settings), Derive indicators (create new variables), Add group and Generate groups (create data groups for multigroup analysis), Clear groups, Export to Excel / CSV.
Tabs: Indicators (statistics of each variable), Correlations (correlation matrix), Data groups, Raw data.
Summary line: 26 indicators, 267 samples, 22 missing values, that is, 26 variables, 267 respondents and 22 blank cells.
Missing values column: the number of blank cells of each variable. Compare it with the original file before you continue, as the SmartPLS documentation advises (SmartPLS GmbH, n.d.-b).
Standard deviation column.
The table also shows the mean, median, minimum and maximum of the scale (Scale min, Scale max) and of the data (Observed min, Observed max). The table has more columns than the window shows; drag the horizontal scroll bar to see the rest.
Two points when comparing with SPSS (the SPSS posts):
The means match: CONF1 has a mean of 3.875 in both SmartPLS and R.
The standard deviation is slightly smaller: CONF1 has 0.961 in SmartPLS but 0.963 in SPSS and R. The reason is that SmartPLS divides by n, whereas SPSS and R divide by n - 1. The difference has no effect on the PLS-SEM results, but when you report descriptive statistics in your thesis, take all numbers from one program for consistency.
If the data file shows "not licensed". With the Student license, the 267-row file can still be imported, but in the Workspace pane it is grayed out with the label not licensed next to its name, and it cannot be used in a model. This was observed in an earlier test with the Student license; after the trial was activated, the file returned to normal. The screenshots of the data in this post were taken with the trial, so the data file is shown as usable.
4. Draw the measurement model
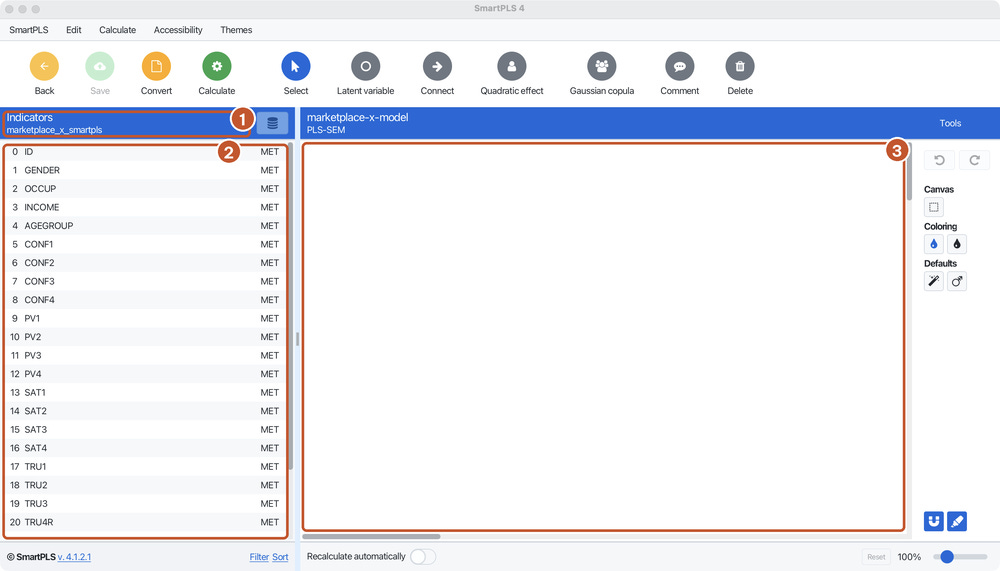
Step 1. Select the project Marketplace X, click the PLS-SEM button on the toolbar, name the model (here marketplace-x-model) and click Save, as in Post 32. Because the project already holds data, the Indicators pane on the left lists the 26 variables (Figure 8).
Step 2. In the Indicators pane, click CONF1, hold Shift and click CONF4 to select all four items. Drag the group and drop it on the canvas. A naming box appears: type CONFIRM and press Enter (Figure 9). SmartPLS creates the construct CONFIRM measured by CONF1 to CONF4 (SmartPLS GmbH, n.d.-f). While several items are selected, the bottom of the Indicators pane shows the highest correlation among them; in the screenshot it reads The best correlation between CONF2 and CONF4 is 0.580.

Naming tip: use a construct name that differs from the item names, in capital letters without spaces or accents, following the convention of the AMOS posts: CONFIRM, VALUE, SATISF, TRUST, INTENT. The later posts use the same names.
Step 3. Repeat Step 2 for the other four constructs:
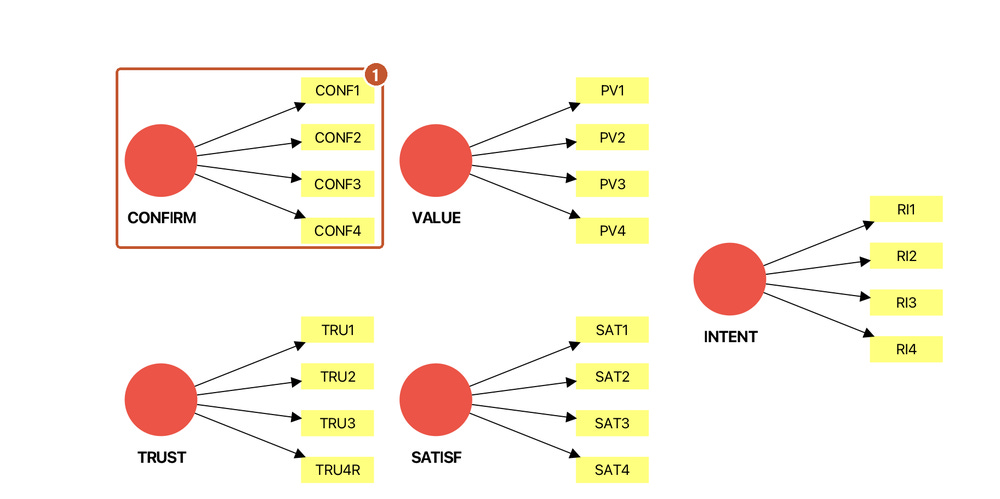
Figure 10 shows two things:
The arrows point from the construct to the items: by default SmartPLS uses a reflective measurement model, which fits the five concepts of the Marketplace X study (Post 31, "What Is SmartPLS? PLS-SEM vs CB-SEM"). If a concept is formative, right-click the construct and choose Invert measurement model to reverse the arrows (SmartPLS GmbH, n.d.-f). Post 36, "Evaluating Formative Measurement Models in SmartPLS 4" discusses formative models.
The red circles: on the computer used for the screenshots, a construct is red while it is not connected to any other construct, and turns blue once it is connected by a path (Section 5).
Step 4 (optional). To make the diagram easier to read, move the items outwards: right-click the construct, choose Align the indicators, then choose a direction. Or hold Alt + Shift, click the construct and drag in the direction where the items should go (SmartPLS GmbH, n.d.-f). The complete model in Section 5 places the items of CONFIRM and TRUST on the left, VALUE at the top, SATISF at the bottom and INTENT on the right.
Drawing without a mouse. The Accessibility menu of the model window has two commands, New construct and New connection (Figure 11). The New construct dialog has a name box, filled in from the selected items, and two boxes for the x and y position on the canvas. This is useful with a screen reader or when drag and drop is difficult.

5. Draw the structural model
Step 1. Click the Connect button on the toolbar.
Step 2. Click the source construct, hold the mouse button, drag to the target construct and release (SmartPLS GmbH, n.d.-f). Repeat for the seven paths:
Note on hypothesis numbering. Posts 2 and 14 use six hypotheses. From Post 26 and throughout the PLS-SEM part, the model has an extra direct path from Confirmation to Repurchase intention, so the series uses seven hypotheses and renumbers from H4: H4 = Confirmation to Repurchase intention (the new path, not in Post 2); H5 = Perceived value to Repurchase intention (H4 in Post 2); H6 = Satisfaction to Repurchase intention (H5 in Post 2); H7 = Trust to Repurchase intention (H6 in Post 2). H1 to H3 stay the same.
Step 3. Click Select to leave the connect mode, then click Save to save the model. Once the model is saved, the Save button turns pale.
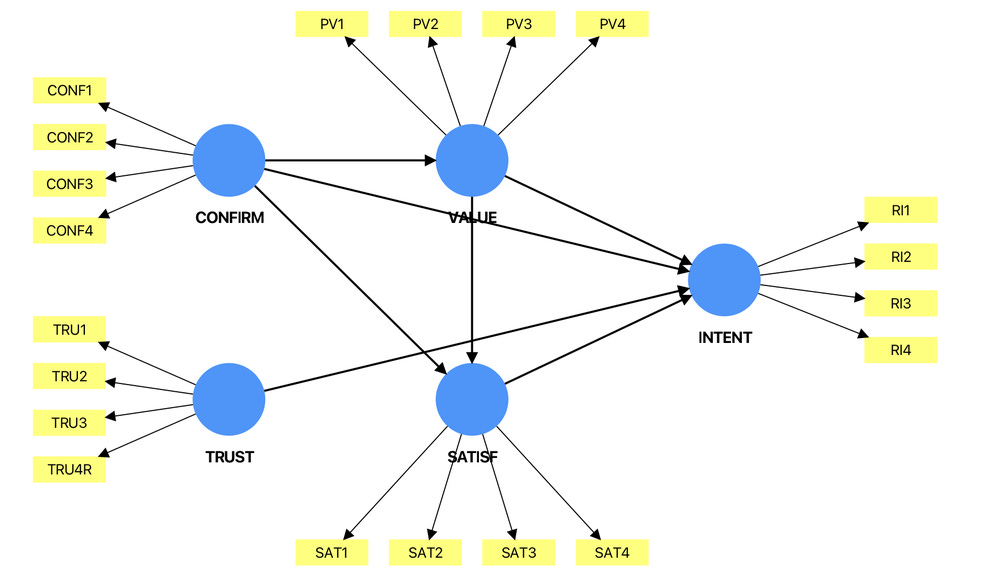
Check Figure 12 before running anything:
All seven arrows between the constructs are present and point the right way. Connecting in the wrong direction (for example from VALUE to CONFIRM) is a common mistake; delete that path with the Delete button and connect it again.
No red circles remain.
TRUST is connected only to INTENT, as in the model of Post 26.
6. Run the algorithm once to check the model
Run the algorithm once to make sure the model is drawn correctly. This is not yet the evaluation step.
Step 1. Choose Calculate > PLS-SEM algorithm. The dialog has two tabs (Figure 13):
PLS setup: Weighting scheme is Path (path weighting scheme, the default and the recommended setting), Type of results is Standardized, Initial weight is Default (initial weights of 1) (SmartPLS GmbH, n.d.-c). The maximum number of iterations (3000) and the stop criterion (10 to the power of −7) are fixed in SmartPLS 4, so they no longer appear in the dialog.
Data: set Missing value algorithm to Casewise deletion (reasons in Section 7). Leave Weighting vector at None.
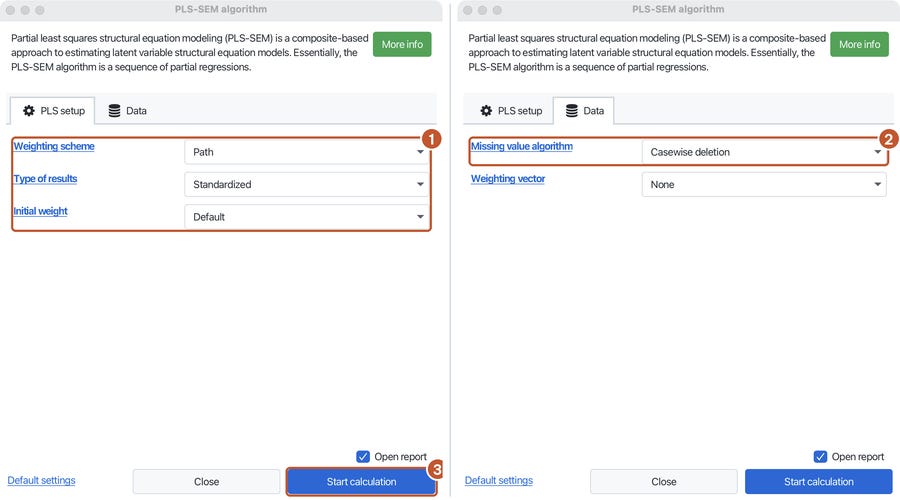
Step 2. Click Start calculation. With Open report ticked, the report opens right away (Figure 14).
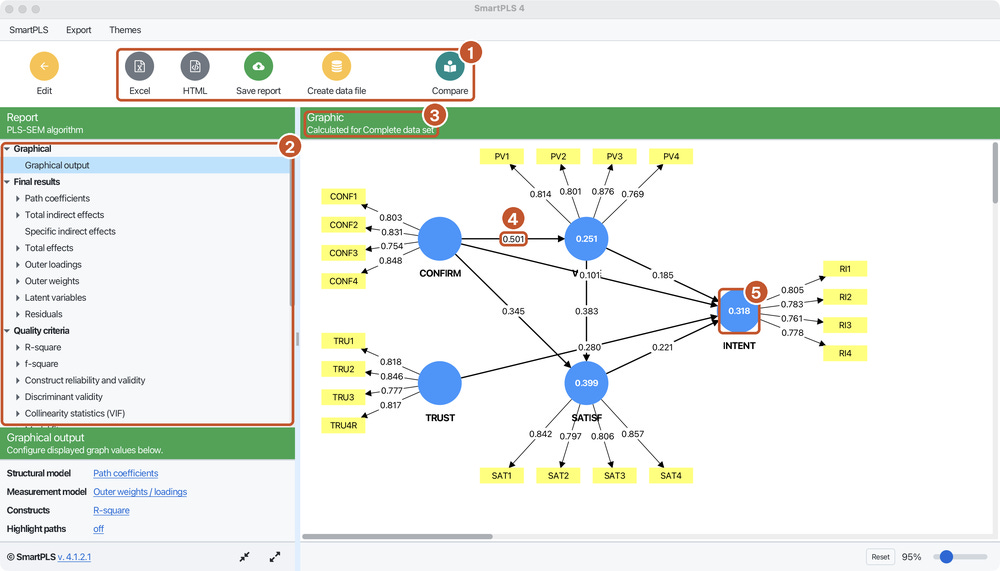
The report screen contains:
Toolbar: export the report to Excel or HTML, save the report (Save report), create a data file from the results (Create data file) and the Compare button.
List of results: Final results (path coefficients, loadings, weights and more) and Quality criteria (R², f², reliability, discriminant validity, VIF and more). Later posts read these items one by one.
The line Calculated for Complete data set: the algorithm ran on the complete cases, as Casewise deletion implies.
Path coefficients on the arrows and outer loadings on the lines to the items.
R² inside the circles of the endogenous constructs.
To confirm that the model is drawn correctly, compare the results with numbers computed independently with cSEM on the same data:
The two sets of numbers agree to the third decimal, and they agree with the PLS-SEM column of Post 31. The loadings of the 20 items also agree (for example CONF1 0.803, PV3 0.876, RI3 0.761). The model is drawn correctly.
7. Choose a missing value treatment
SmartPLS offers four options in the Missing value algorithm box (SmartPLS GmbH, n.d.-b):
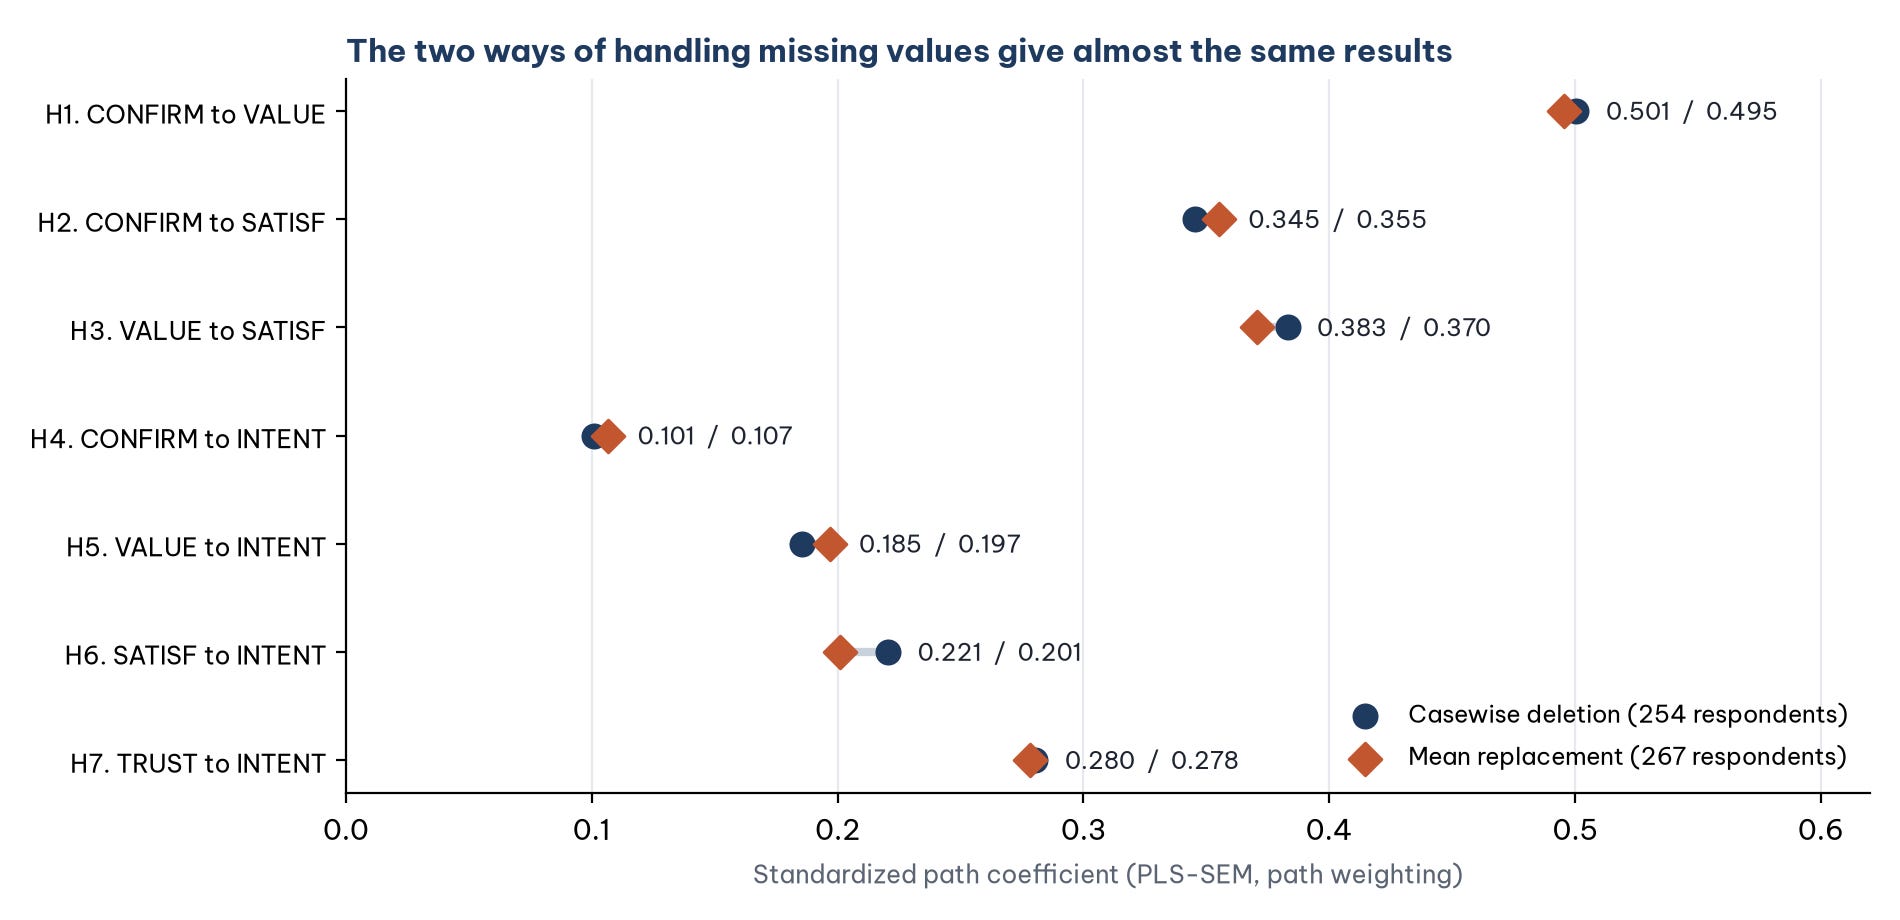
The SmartPLS guide recommends Mean replacement only when each item has less than 5% blank cells and the blanks occur at random; if an item or a respondent has more than 15% blank cells, consider removing it (SmartPLS GmbH, n.d.-b). The Marketplace X data have at most 1.12% blank cells in one item, so both options are acceptable. Figure 15 compares the results of the two.
This series uses Casewise deletion for three reasons:
No values are filled in for the respondents: Mean replacement puts answers into the data that nobody gave, and slightly reduces the variance.
Only 13 respondents (4.9%) are lost, leaving a sample of 254, still above the 250 computed in Post 4, "How Large Should Your Sample Be? Formulas and Rules of Thumb for a Thesis".
The results can be cross-checked: they match Post 31 (JASP and cSEM, which require complete data).
One technical detail was checked: SmartPLS Casewise deletion drops only respondents with blanks in the items used in the model, not in the other columns of the file. The Marketplace X file has one respondent (ID 59) with a blank age group who answered all 20 items. If this respondent were also dropped, the sample would be 253, H1 would be 0.500 and the R² of intention 0.317, which differs from SmartPLS. The SmartPLS results match the sample of 254, so this respondent is kept (script compare_pls.R).
In the AMOS posts, the model was estimated with FIML on all 267 respondents (Post 26). SmartPLS has no FIML. When you write your thesis, state the missing value treatment and the number of observations actually used (here 254), not the original sample size.
Five common mistakes
Not declaring the missing value code. SmartPLS treats -99 as a real answer. Sign: Missing equals 0 and Min equals -99 in the import dialog (Figure 4).
Importing an SPSS or Excel file, or a file with more than 100 rows, with the Student license. SmartPLS shows Feature locked or marks the file as not licensed. Use a CSV file, or the trial or Professional license.
Naming a construct after one of its items. Use names that differ from the item names (for example CONFIRM, not CONF1), so that the later posts match.
Connecting a path in the wrong direction. Check each arrow against the hypothesis table before running.
Forgetting to save the model. Click Save after drawing; once saved, the Save button turns pale.
Frequently asked questions
Do I need to delete unused columns (ID, gender, N_MISSING and so on) before importing?
No. SmartPLS uses only the items assigned to the model, and Casewise deletion only looks at those items (Section 7). Keeping the demographic variables also helps with multigroup analysis later.
Should blank cells stay empty or be coded as -99?
Both work (SmartPLS GmbH, n.d.-b). Coding -99 separates deliberately skipped answers from cells lost while copying data, and it is easy to check by eye. What matters is declaring the right code in the import dialog.
What if my Excel file uses a decimal comma?
Choose the matching Locale in the import dialog, or save the file again with a decimal point. Check the Min, Max and Mean columns after importing to make sure the numbers were read correctly.
Can a drawn model be reused with other data?
Yes. A project can hold several data files and several models. The small line under the word Indicators shows the data file the model is using (Figure 8).
References
Rademaker, M. E., & Schuberth, F. (2026). cSEM: Composite-based structural equation modeling (R package version 0.7.1) [Computer software]. https://CRAN.R-project.org/package=cSEM
Ringle, C. M., Wende, S., & Becker, J.-M. (2026). SmartPLS 4 (Version 4.1.2.1) [Computer software]. SmartPLS GmbH. https://www.smartpls.com
SmartPLS GmbH. (n.d.-a). Import a data file (raw data or covariance matrix). Retrieved November 6, 2026, from https://www.smartpls.com/documentation/tutorials/import-datafiles/
SmartPLS GmbH. (n.d.-b). Missing values in SmartPLS. Retrieved November 6, 2026, from https://www.smartpls.com/documentation/functionalities/missing-values/
SmartPLS GmbH. (n.d.-c). The PLS-SEM algorithm: How SmartPLS estimates models. Retrieved November 6, 2026, from https://www.smartpls.com/documentation/algorithms-and-techniques/core-algorithm/pls/
SmartPLS GmbH. (n.d.-d). Pricing and licenses. Retrieved November 6, 2026, from https://smartpls.com/pricing/
SmartPLS GmbH. (n.d.-e). Working with large data files in SmartPLS. Retrieved November 6, 2026, from https://www.smartpls.com/faq/smartpls4/large-data-files/
SmartPLS GmbH. (n.d.-f). Your first PLS path model. Retrieved November 6, 2026, from https://www.smartpls.com/documentation/tutorials/first-pls-path-model/
Discussion about this post