Formative Measurement in SmartPLS 4: Redundancy Analysis, VIF and Weights
Evaluate formative constructs in three steps, redundancy analysis, collinearity and bootstrapped outer weights, and decide which indicators to keep


Key takeaways
Formative indicators form their construct, so loadings above 0.708, Cronbach's alpha, AVE and HTMT no longer apply.
Convergent validity comes from a redundancy analysis against a global single item, which must be planned when you design the questionnaire; the path should reach 0.708.
Collinearity is checked with VIF: 5 or higher is critical and below 3 is ideal. In the Corporate reputation example the highest VIF is 2.269.
A non-significant outer weight is not a reason to remove an indicator: keep it if its loading is 0.50 or higher or significant, as for all five such indicators here.
The measurement mode must follow the definition of the construct, never the results.
Post 34 and Post 35 evaluated the reflective measures of the Marketplace X model. Not every construct is measured that way, though. Some constructs are formed by their components; their indicators are called formative. For this type of measure, the 0.708 loading threshold, Cronbach's alpha, AVE and HTMT no longer apply. This post presents the three evaluation steps specific to formative measurement models (Hair et al., 2019).
All five constructs of the Marketplace X study are reflective, so this post uses the sample project "Corporate reputation (primer)" that comes with SmartPLS. It is the classic example of the book by Hair et al. (2022) and has four carefully designed formative constructs.
Sample scripts. The R script and output tables for this post are in the research-data-analysis repository on GitHub (folder
scripts/). The data belong to SmartPLS GmbH and are not redistributed; the filedata/NOTICE.txtexplains how to open the sample project and point the script to it. Download the whole repository with Code > Download ZIP.
About the figures and numbers. All figures are real screenshots of SmartPLS 4.1.2.1 (Ringle et al., 2026; 30-day trial) with the sample project Corporate reputation (primer): 344 respondents, missing values handled by Mean replacement as set in the project. The citation note with a book-cover image shown on the canvas of the sample project has been painted white or cropped out of the screenshots. Every number was cross-checked with the R package cSEM 0.7.1 (Rademaker & Schuberth, 2026) in the script
evaluate_formative.R(in the repository'sscripts/folder); bootstrap p values may differ in the third decimal between the two programs because the random bootstrap samples differ. The sample data belong to SmartPLS and are not included in the repository; install the sample project yourself (Post 32, Section 4).
1. How do formative measures differ from reflective ones?
Example from the sample project: QUAL (quality of the company) is formed by eight indicators, qual_1 to qual_8, each about a different aspect of quality. A company can be very good in one aspect but weak in another: the indicators need not move in the same direction, and each one contributes part of the overall construct (Diamantopoulos & Winklhofer, 2001).
The extended model of the sample project (Figure 1) has four formative constructs: ATTR (attractiveness), CSOR (corporate social responsibility), PERF (performance) and QUAL (quality). They affect two dimensions of corporate reputation, COMP (competence) and LIKE (likeability), which are reflective; these two in turn affect customer CUSA (satisfaction) and CUSL (loyalty).
Step 1. Open the project Example – Corporate reputation (primer) in the Workspace pane and double-click the model 2 Extended model.
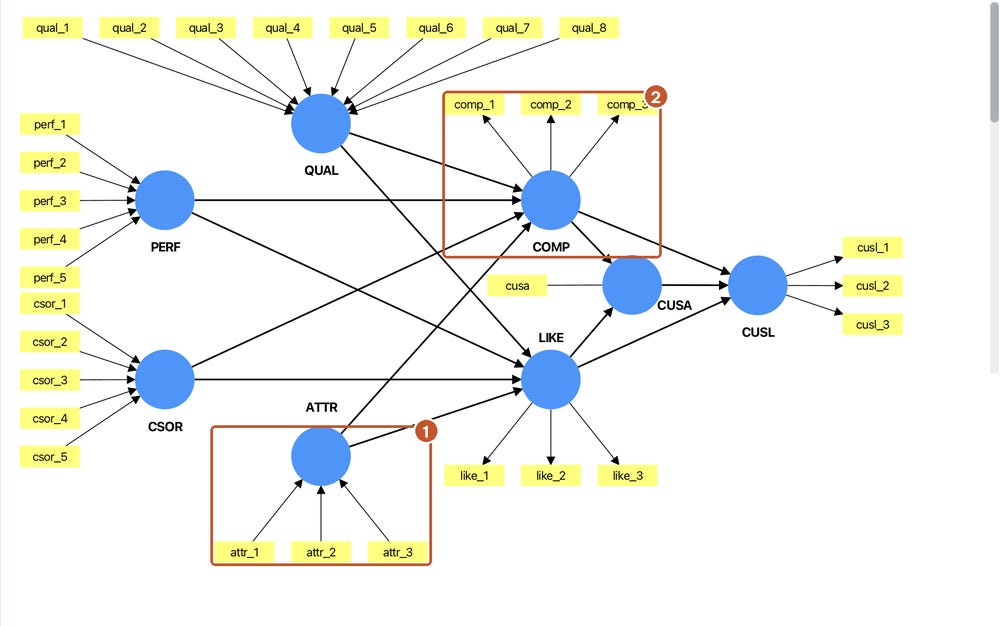
To switch a measure from reflective to formative or back, right-click the latent variable and choose Invert measurement model (Post 33). The choice of measurement mode must rest on the theoretical content of the construct, not on the results.
2. Step 1: Convergent validity with redundancy analysis
Does the formative measure capture the right construct? The check is a redundancy analysis (Chin, 1998): you relate the formative construct to another measure of the same construct, usually a global single item. For ATTR, for example, the global item attr_global asks about the overall attractiveness of the company.
Threshold: a path coefficient between the two measures of 0.708 or higher, that is, an R² of at least 0.50 (Hair et al., 2019).
Redundancy analysis has to be planned when you design the questionnaire: you need a global item for each formative construct. It cannot be added after the data are collected.
Step 2. Open the model 3a Redundancy analysis ATTR (already drawn in the sample project), choose Calculate > PLS-SEM algorithm and click Start calculation (Figure 2).

Result: all four formative measures have path coefficients above 0.708: convergent validity is established. Note that the weights of the three ATTR indicators in the redundancy model (0.573, 0.176 and 0.523) differ from those in the full model, because weights in PLS-SEM depend on the latent variables the construct is connected to. The weights evaluated in Step 3 are those of the full model.
3. Step 2: Collinearity (VIF)
The outer weights of formative indicators are estimated like coefficients of a multiple regression. When the indicators correlate too strongly with each other, the weights become unstable and may change sign or lose significance. The VIF (variance inflation factor) measures this.
Thresholds (Hair et al., 2019): a VIF of 5 or higher signals a critical problem; ideally the VIF is below 3. VIF values between 3 and 5 may already have an effect.
Step 3. Run the PLS-SEM algorithm on the model 2 Extended model, then open Quality criteria > Collinearity statistics (VIF) > Outer model – List (Figure 3).
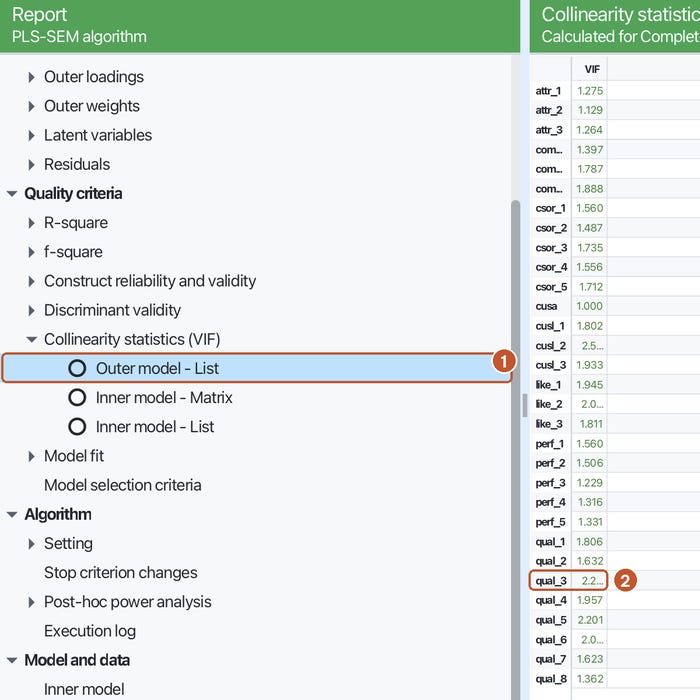
This table lists the VIF of every indicator. Read only the VIF of the formative indicators; the VIF of reflective indicators (comp, like, cusl) is not used in this evaluation.
Result: the highest VIF is 2.269, below 3: there is no collinearity problem.
4. Step 3: Significance and relevance of the outer weights
The outer weight shows the relative contribution of each indicator to the construct, controlling for the other indicators. The outer loading shows the absolute contribution: the correlation of the indicator with the construct on its own (Cenfetelli & Bassellier, 2009). Testing significance requires bootstrapping.
Step 4. Choose Calculate > Bootstrapping, keep the settings of the sample project (5000 subsamples) and click Start calculation. In the report, open Final results > Outer weights > Mean, STDEV, T values, p values (Figure 4). Post 39 explains the bootstrap settings in detail.
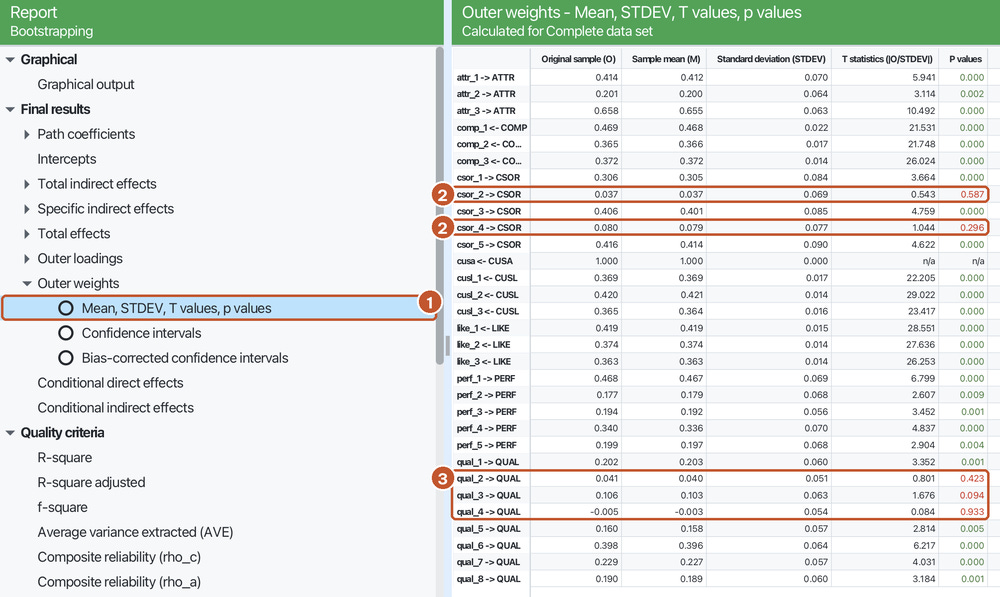
Five indicators have non-significant weights:
Do not remove these indicators straight away. The decision rule (Hair et al., 2019) is summarized in Figure 5:
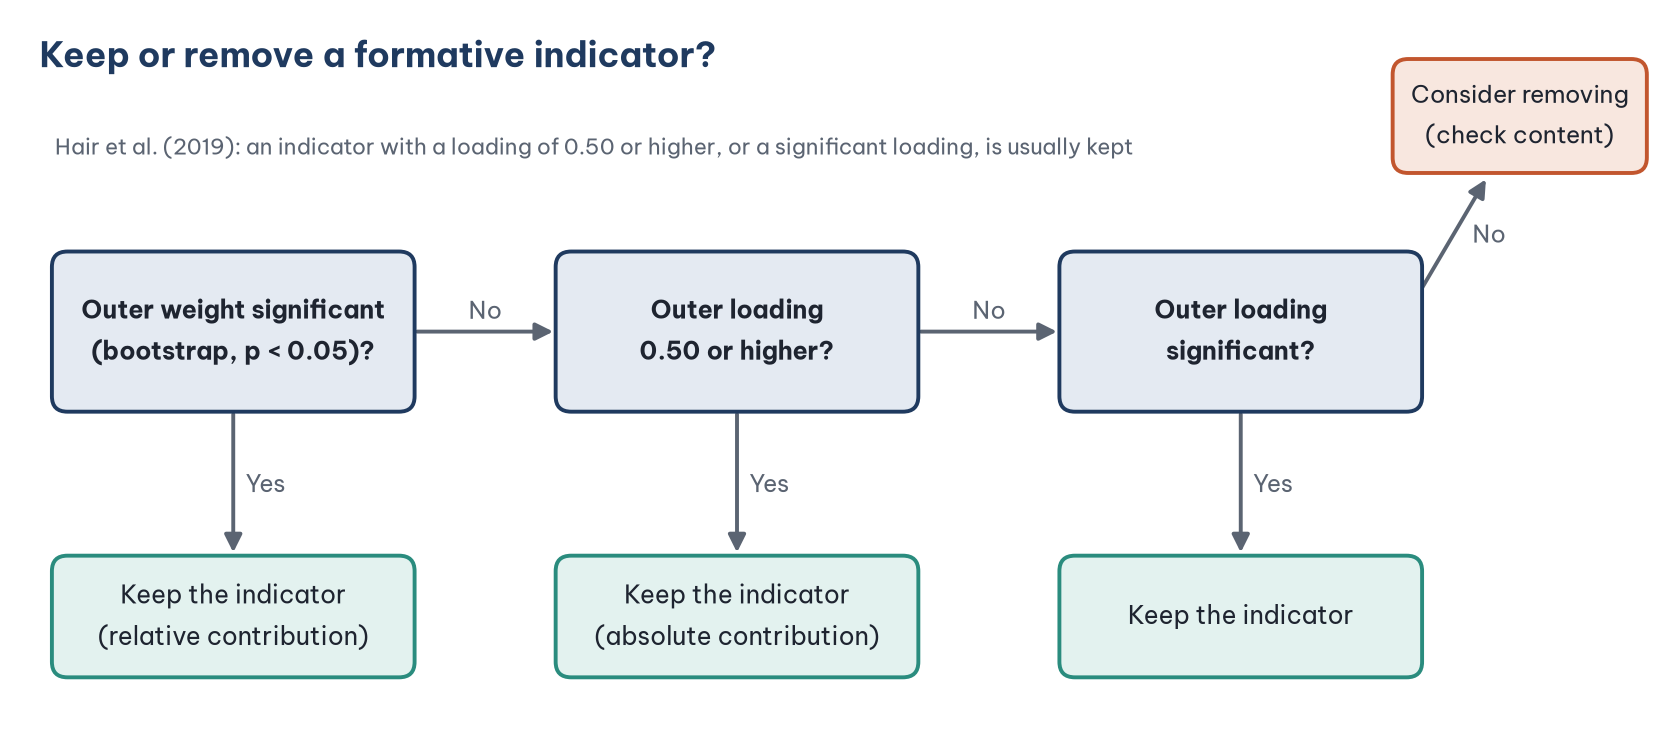
Significant weight: keep the indicator.
Non-significant weight, but a loading of 0.50 or higher, or a significant loading: usually keep it, because the indicator makes a substantial absolute contribution even though its relative contribution next to the other indicators is small.
Both weight and loading low and non-significant: consider removing it, but check the content first: removing a formative indicator removes part of the definition of the construct.
Step 5. In the same bootstrap report, open Final results > Outer loadings > Mean, STDEV, T values, p values (Figure 6) to see the loadings.
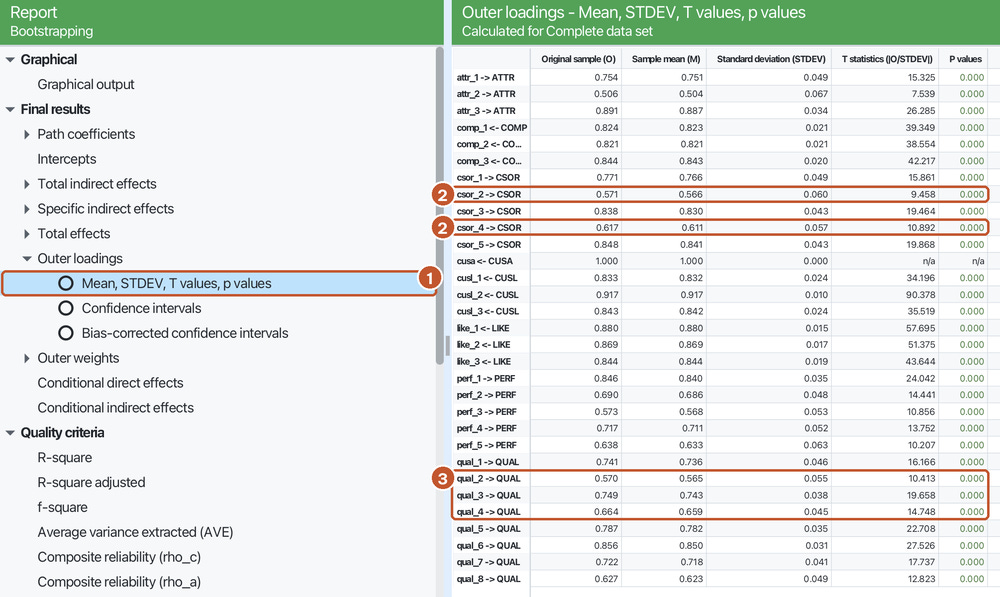
Result: the five indicators have loadings from 0.570 to 0.749, all significant (p < 0.001): keep all five. Figure 7 places the weights next to the loadings for all 21 formative indicators.
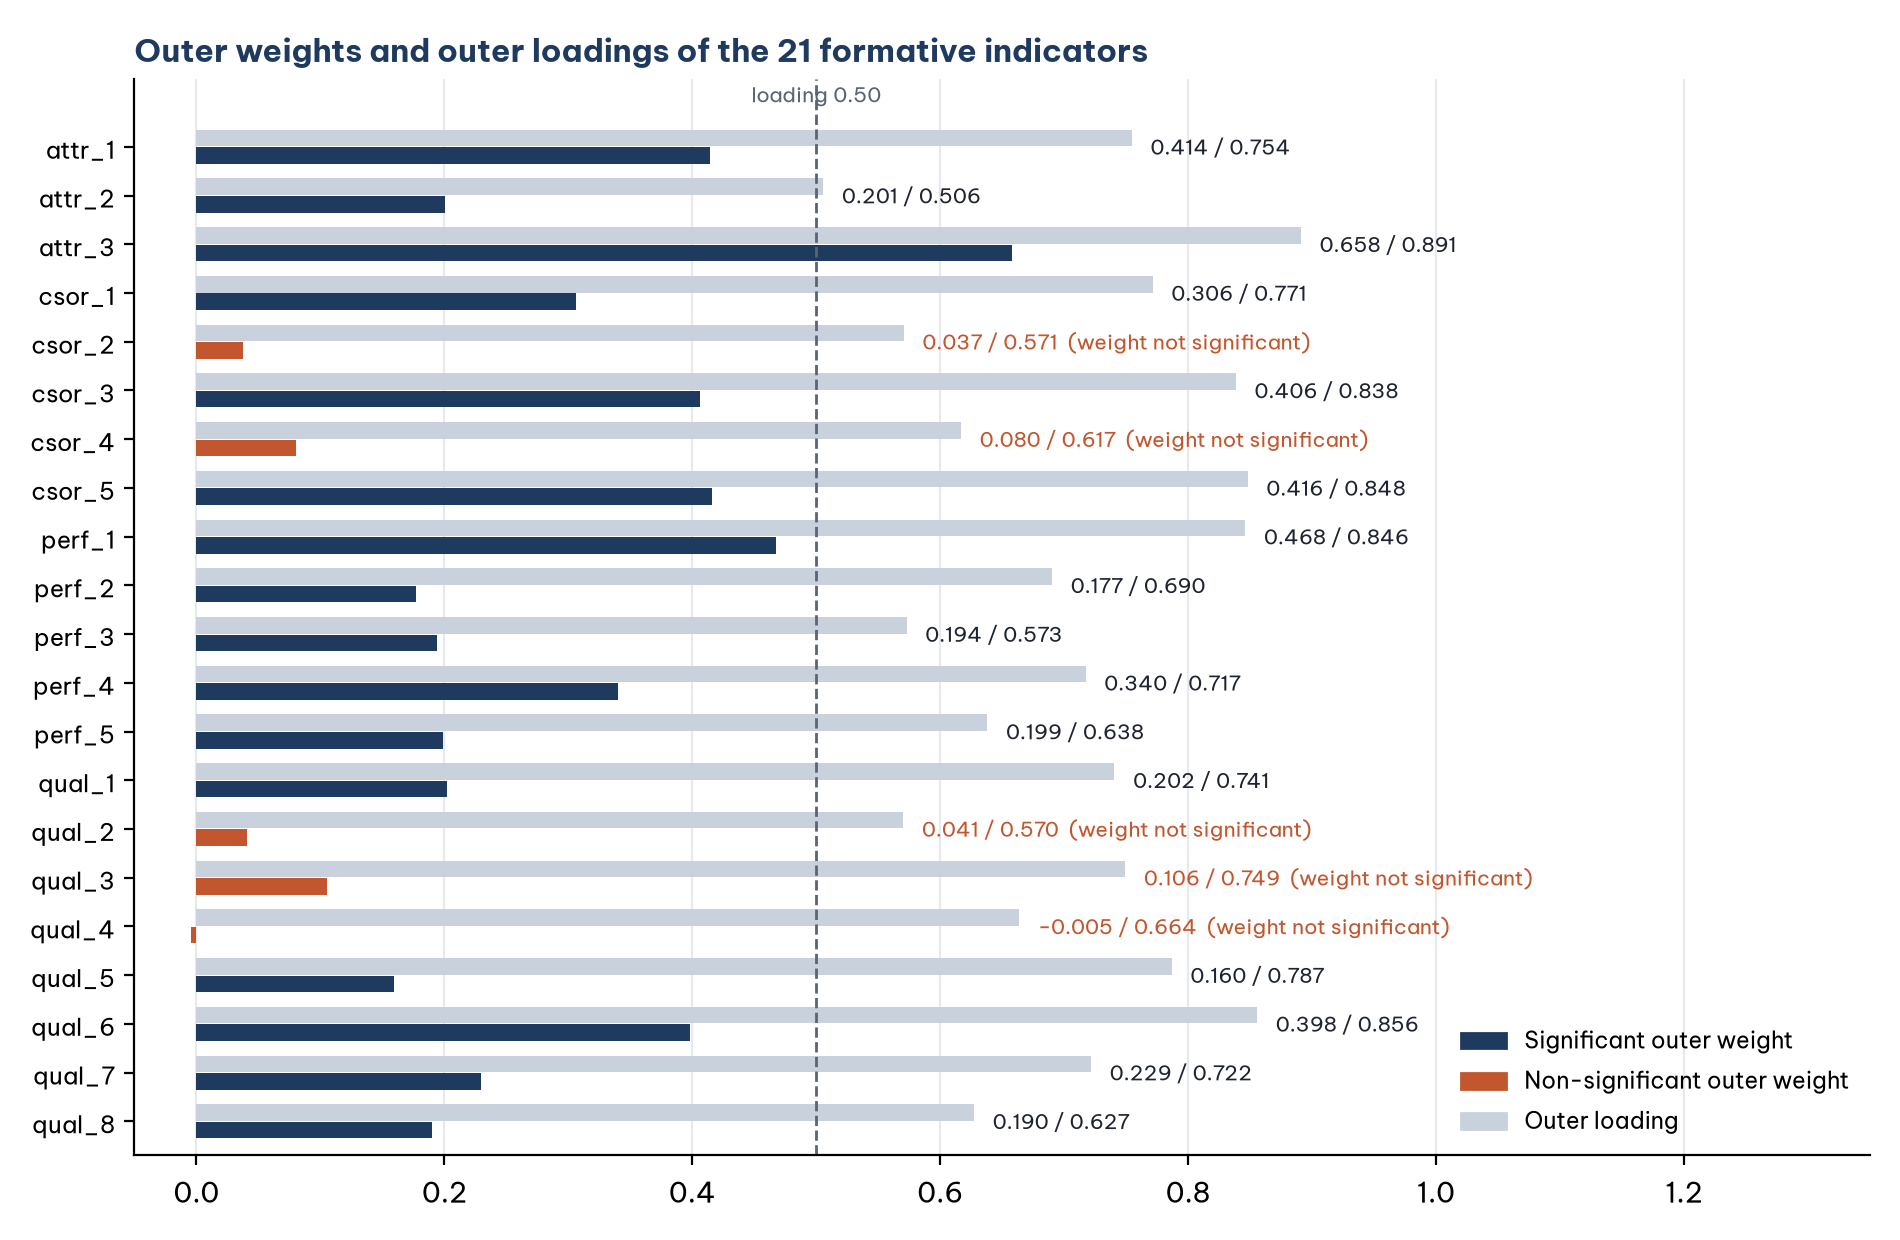
Two points stand out in Figure 7:
The negative weight of qual_4 (−0.005) does not mean that quality in this aspect lowers QUAL. The weight is close to zero and not significant; the positive loading (0.664) shows that qual_4 still moves in the same direction as the construct.
The indicator with the largest weight in each construct (attr_3, csor_5, perf_1, qual_6) is the aspect the company should prioritize when it wants to improve that construct. This is the practical reading of formative weights.
5. Reporting the results
The four formative measures were evaluated following Hair et al. (2019). The redundancy analysis yielded path coefficients from 0.805 to 0.874, above the 0.708 threshold, establishing convergent validity. The VIF values of the formative indicators ranged from 1.129 to 2.269, below 3, indicating no collinearity. Bootstrapping (5000 subsamples) showed that 16 of the 21 outer weights were significant at the 5% level. The five indicators with non-significant weights (csor_2, csor_4, qual_2, qual_3, qual_4) all had loadings of 0.570 or higher that were significant (p < 0.001), so they were retained for their absolute contribution to the construct.
The table in your thesis should give, for each formative indicator: the outer weight, the p value of the weight, the outer loading, the p value of the loading and the VIF; add a small table for the redundancy analysis.
Five common mistakes
Evaluating formative measures with alpha, AVE or HTMT. These criteria apply to reflective measures only.
Removing an indicator only because its weight is not significant, without looking at its loading.
Choosing formative or reflective based on the results (flipping the arrows to make the criteria look better). The measurement mode must follow from the definition of the construct.
No global item in the questionnaire, so redundancy analysis is impossible. Add one global item for each formative construct when you design the questionnaire.
Reading the VIF of reflective indicators to draw conclusions about collinearity in the formative measurement model.
Frequently asked questions
How do I know whether a construct is formative or reflective?
Ask: if the construct increases, do all indicators increase together? If yes (for example, when satisfaction rises, all four SAT items rise), it is reflective. If the indicators are separate components, and one rising does not pull the others up (for example, product quality and service quality), it is formative (Diamantopoulos & Winklhofer, 2001).
Does a formative measure need many indicators?
It needs enough indicators to cover every aspect of the construct according to its definition. A missing aspect means a missing part of the construct, unlike reflective measures, where four items are interchangeable.
Can I use formative measures in AMOS?
CB-SEM has difficulty estimating formative measures: a formative construct must be connected to at least two other variables to be identified. This is one reason to choose PLS-SEM when the model has formative constructs (Post 31).
Can the Student license run this example?
The Student license includes the PLS-SEM algorithm and bootstrapping, but it accepts at most 100 rows of data (Post 32); the sample project has 344 rows, so you need the trial or the Professional license.
References
Cenfetelli, R. T., & Bassellier, G. (2009). Interpretation of formative measurement in information systems research. MIS Quarterly, 33(4), 689–707. https://doi.org/10.2307/20650323
Chin, W. W. (1998). The partial least squares approach to structural equation modeling. In G. A. Marcoulides (Ed.), Modern methods for business research (pp. 295–336). Lawrence Erlbaum Associates.
Diamantopoulos, A., & Winklhofer, H. M. (2001). Index construction with formative indicators: An alternative to scale development. Journal of Marketing Research, 38(2), 269–277. https://doi.org/10.1509/jmkr.38.2.269.18845
Hair, J. F., Hult, G. T. M., Ringle, C. M., & Sarstedt, M. (2022). A primer on partial least squares structural equation modeling (PLS-SEM) (3rd ed.). SAGE Publications.
Hair, J. F., Risher, J. J., Sarstedt, M., & Ringle, C. M. (2019). When to use and how to report the results of PLS-SEM. European Business Review, 31(1), 2–24. https://doi.org/10.1108/EBR-11-2018-0203
Rademaker, M. E., & Schuberth, F. (2026). cSEM: Composite-based structural equation modeling (R package version 0.7.1) [Computer software]. https://CRAN.R-project.org/package=cSEM
Ringle, C. M., Wende, S., & Becker, J.-M. (2026). SmartPLS 4 (Version 4.1.2.1) [Computer software]. SmartPLS GmbH. https://www.smartpls.com
Discussion about this post