The 7-Step Quantitative Research Process for Theses and Dissertations
From practical evidence and a research gap to hypotheses, study design and the final report, with outputs and a checklist for every step


Key takeaways
A research problem comes from two sources: a practical problem backed by evidence and a research gap in the literature.
Separate the symptom (what is already known) from the research problem (what is not yet known); preliminary data show that a problem exists, not why.
A base theory alone is not enough: it explains the mechanism, while prior studies supply evidence, added concepts and validated scales.
Each hypothesis needs an argument from theory and evidence from prior studies, and the analysis technique must be chosen before the sample size is set.
Every adjustment to the model, the scales or the questionnaire should happen before the main data collection in Step 5.
Many students open SPSS before they know exactly what they want to test. They run Cronbach's alpha, EFA and regression, and only when they write the discussion chapter do they find that the scales do not match the hypotheses, that the sample is too small for the chosen technique or that the questionnaire lacks an important variable. Software cannot fix these errors, because they arise in the steps before the data exist.
This post presents a quantitative research process in 7 steps. For each step, it states three things: what to do, what the output is and the checklist that tells you the step is complete.
Throughout this post and the whole series, we use one example topic: "Factors affecting customers' repurchase intention on an e-commerce marketplace: the mediating role of satisfaction." The topic was chosen because it starts from a practical business problem: winning first-time customers is hard, and getting them to come back is even harder. The e-commerce marketplace in the example is called Marketplace X, and all figures about Marketplace X are hypothetical.
If you are not yet clear about the roles of SPSS, AMOS and SmartPLS, read Post 1, "Quantitative Research with SPSS, AMOS and SmartPLS" first.
Overview of the 7 steps
Research methods textbooks divide the process into different numbers of steps, but the common logic always runs from the problem, through theory and design, to data and conclusions (Creswell & Creswell, 2023; Saunders et al., 2023). The division below separates the literature review from model building, because they are two different tasks and the place where students are most often unclear.
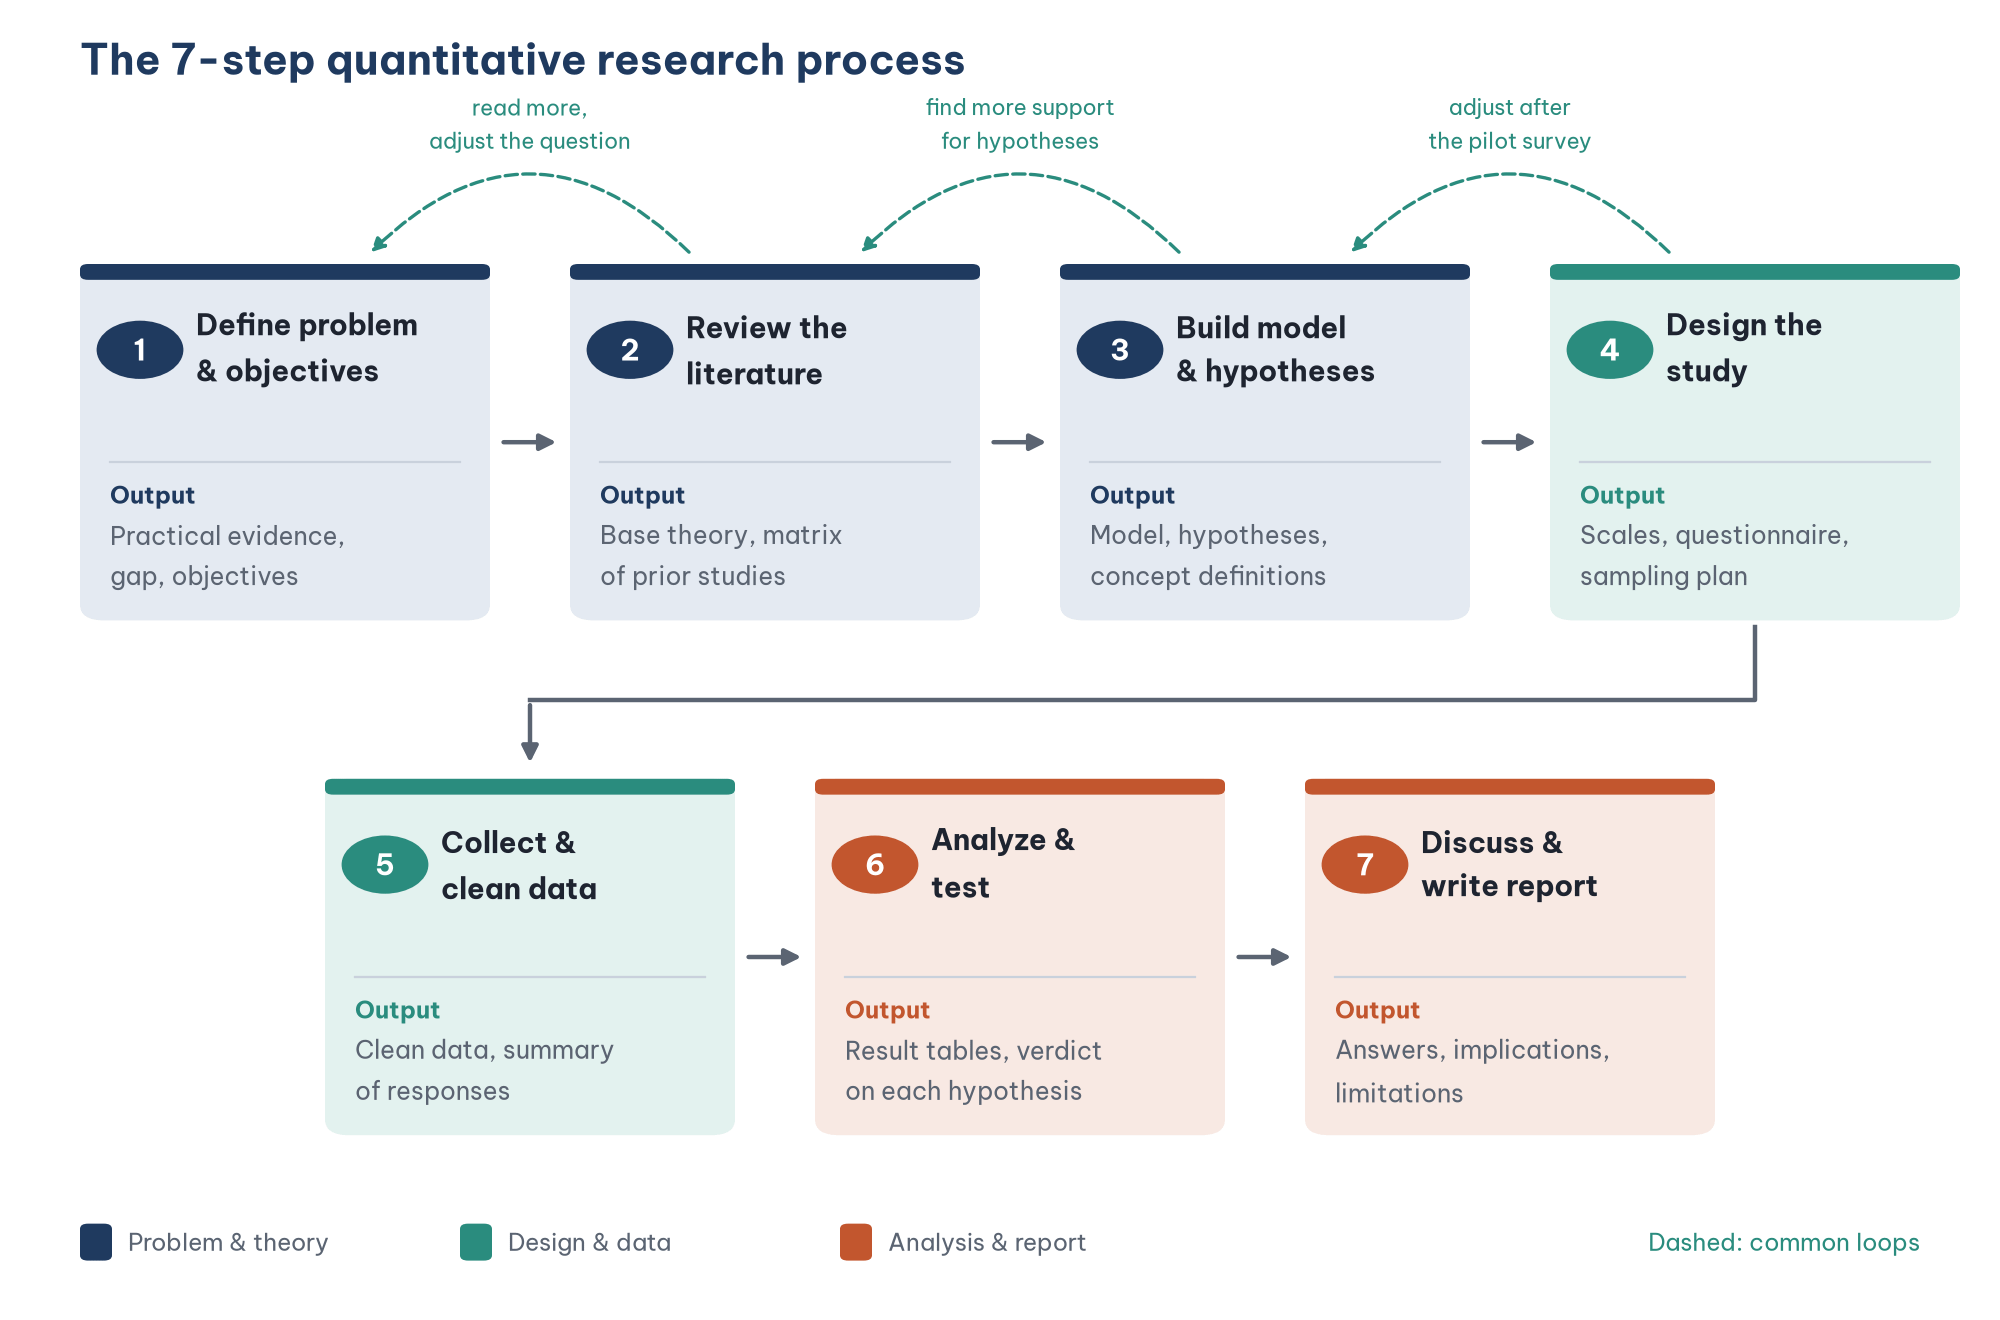
The process is not fully linear. Three common loops are:
Steps 1 and 2 repeat several times: you read the literature to find the problem, and once you have the problem you read more deeply, and you may have to narrow or adjust the research question.
Steps 3 and 2: when you write the hypotheses and cannot find support for an arrow, you go back to the literature or drop that arrow.
Steps 4 and 3: the results of preliminary interviews or the pilot survey may force you to adjust the scales, or even the model.
What matters is that every adjustment happens before the main data collection in Step 5.
Step 1. Define the problem, research questions and objectives
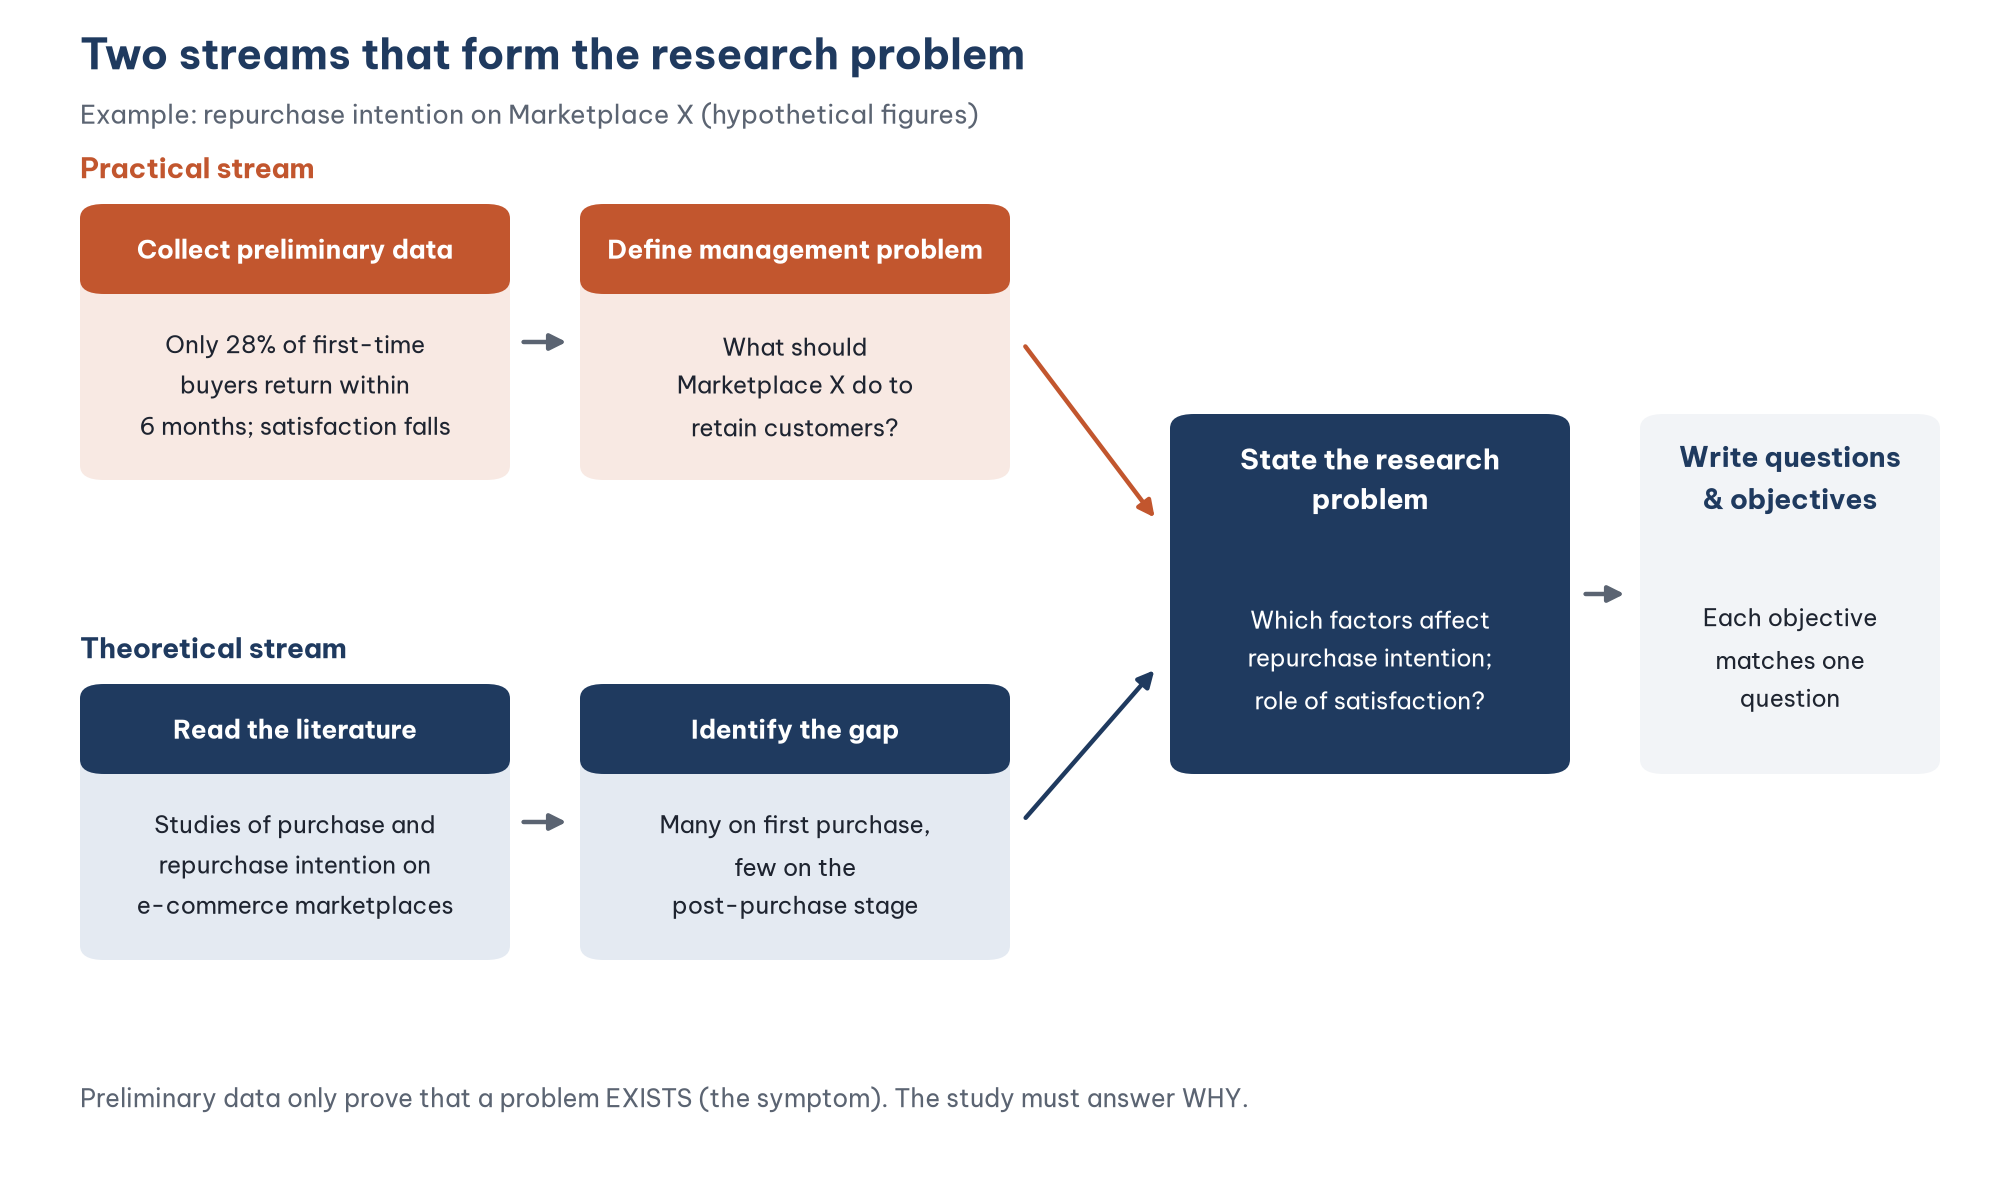
A research topic must answer the question "why study this problem?". The answer usually comes from two sources: a practical problem backed by evidence from data, and a research gap in the literature. The "rationale" or "background" section of a thesis usually presents both.
What to do
1. Collect evidence of the practical problem. A practical problem is a situation that an organization or society faces and wants to improve. Bougie and Sekaran (2019) call this the management problem, the starting point of most applied business research. Evidence can come from four sources:
Internal data of the organization: the rate of returning customers, periodic satisfaction scores, the number of complaints, the order return rate.
Preliminary data you collect yourself: short interviews with a few customers, a small survey or direct observation.
External secondary data: industry reports, official statistics, public customer reviews.
Changes in the context: new policies, new technologies or new competitors that make old practices no longer fit.
Note: practical evidence must show a situation that needs improving. "More and more people shop online" is not a problem; it is a trend. When almost every target customer already shops online, studying "online shopping intention" no longer solves any problem. The real problem of the business at this point is customers who bought once but did not come back.
2. Check the evidence before using it. A single number does not prove that a problem exists. Suppose the internal data of Marketplace X show that only 28% of first-time buyers bought again within 6 months (hypothetical figure). Answer three questions:
Low compared with what? Compare with the previous period, with competitors, with the industry average or with the company's target.
Is the source reliable? Who collected the data, from how many customers and how was it measured?
Is it consistent? Do other sources, such as satisfaction scores or the number of complaints, point in the same direction?
3. Separate the symptom from the research problem. This is where students most often go wrong. For Marketplace X:
Symptom: a low rate of returning customers, falling satisfaction scores. This is what is already known.
Management problem: what should Marketplace X do to retain customers?
Research problem: which factors affect customers' repurchase intention, and what role does satisfaction play in these relationships? This is what is not yet known, and the study must answer it.
Preliminary data only show that there is a problem, not why. Do not conclude the cause directly from preliminary data, for example "customers do not come back because shipping fees are high". Opinions gathered in preliminary interviews are only initial hints about the factors, to be checked against the literature in Step 2.
4. Find the research gap. The practical problem shows that the topic is needed; the gap shows that the topic makes a new contribution. You cannot "invent" a gap; you can only see it after a preliminary reading of the most recent studies on the topic. So Step 1 always comes with an initial round of reading, before the systematic review in Step 2. Gaps usually take one of three forms:
Theoretical gap: a relationship that has not been tested, or studies with conflicting results.
Contextual gap: the relationship has been tested elsewhere, but not yet in your country or market, in this industry or with this group of respondents.
Methodological gap: prior studies used small samples, unsuitable scales or limited analysis techniques.
For the example topic, one possible line of argument is: many studies in the market concerned focus on first-time purchase intention, while the post-purchase stage, where satisfaction and trust decide whether customers come back, has been tested less often. This is only an example of how to argue; you must prove the claim with an actual review in Step 2.
5. Weigh the emphasis according to the type of work. If your program distinguishes a research-oriented thesis from an applied (practice-oriented) project, the emphasis differs. A research-oriented thesis is expected to contribute to theory, so the research gap must be argued clearly. An applied project is expected to propose and test solutions to a practical problem, so the evidence of the practical problem is central. Check your institution's regulations. Whichever type you write, it is still best to include both lines of argument.
6. Write questions and objectives that match one to one. Each specific objective must answer one research question and start with a measurable verb:
7. Define the object and the scope. Many thesis guidelines ask you to separate clearly:
Object of study: what is studied, here repurchase intention, satisfaction and the factors that affect them.
Survey respondents: the people who provide the data, here customers in the chosen city or region who have bought on Marketplace X at least once in the past 6 months.
Scope of the study: the content, the geographic area and the time of data collection.
Output and checklist
Output: the rationale for the topic (practical evidence and research gap), the objectives, questions, object and scope. This is the content of Chapter 1.
Checklist:
The practical problem is a situation that needs improving, with specific figures, a stated source and a point of comparison.
The research problem is stated as something not yet known, not a restatement of the symptom.
The gap is demonstrated with specific studies, not just a general statement such as "there are not many studies".
Each specific objective has exactly one matching question.
The object of study and the survey respondents are written separately.
Step 2. Review the literature: base theory and prior studies
This is the step where the question "is a base theory enough?" usually comes up. The answer is no. A literature review covers two types of sources with different roles, and a good research model needs both.
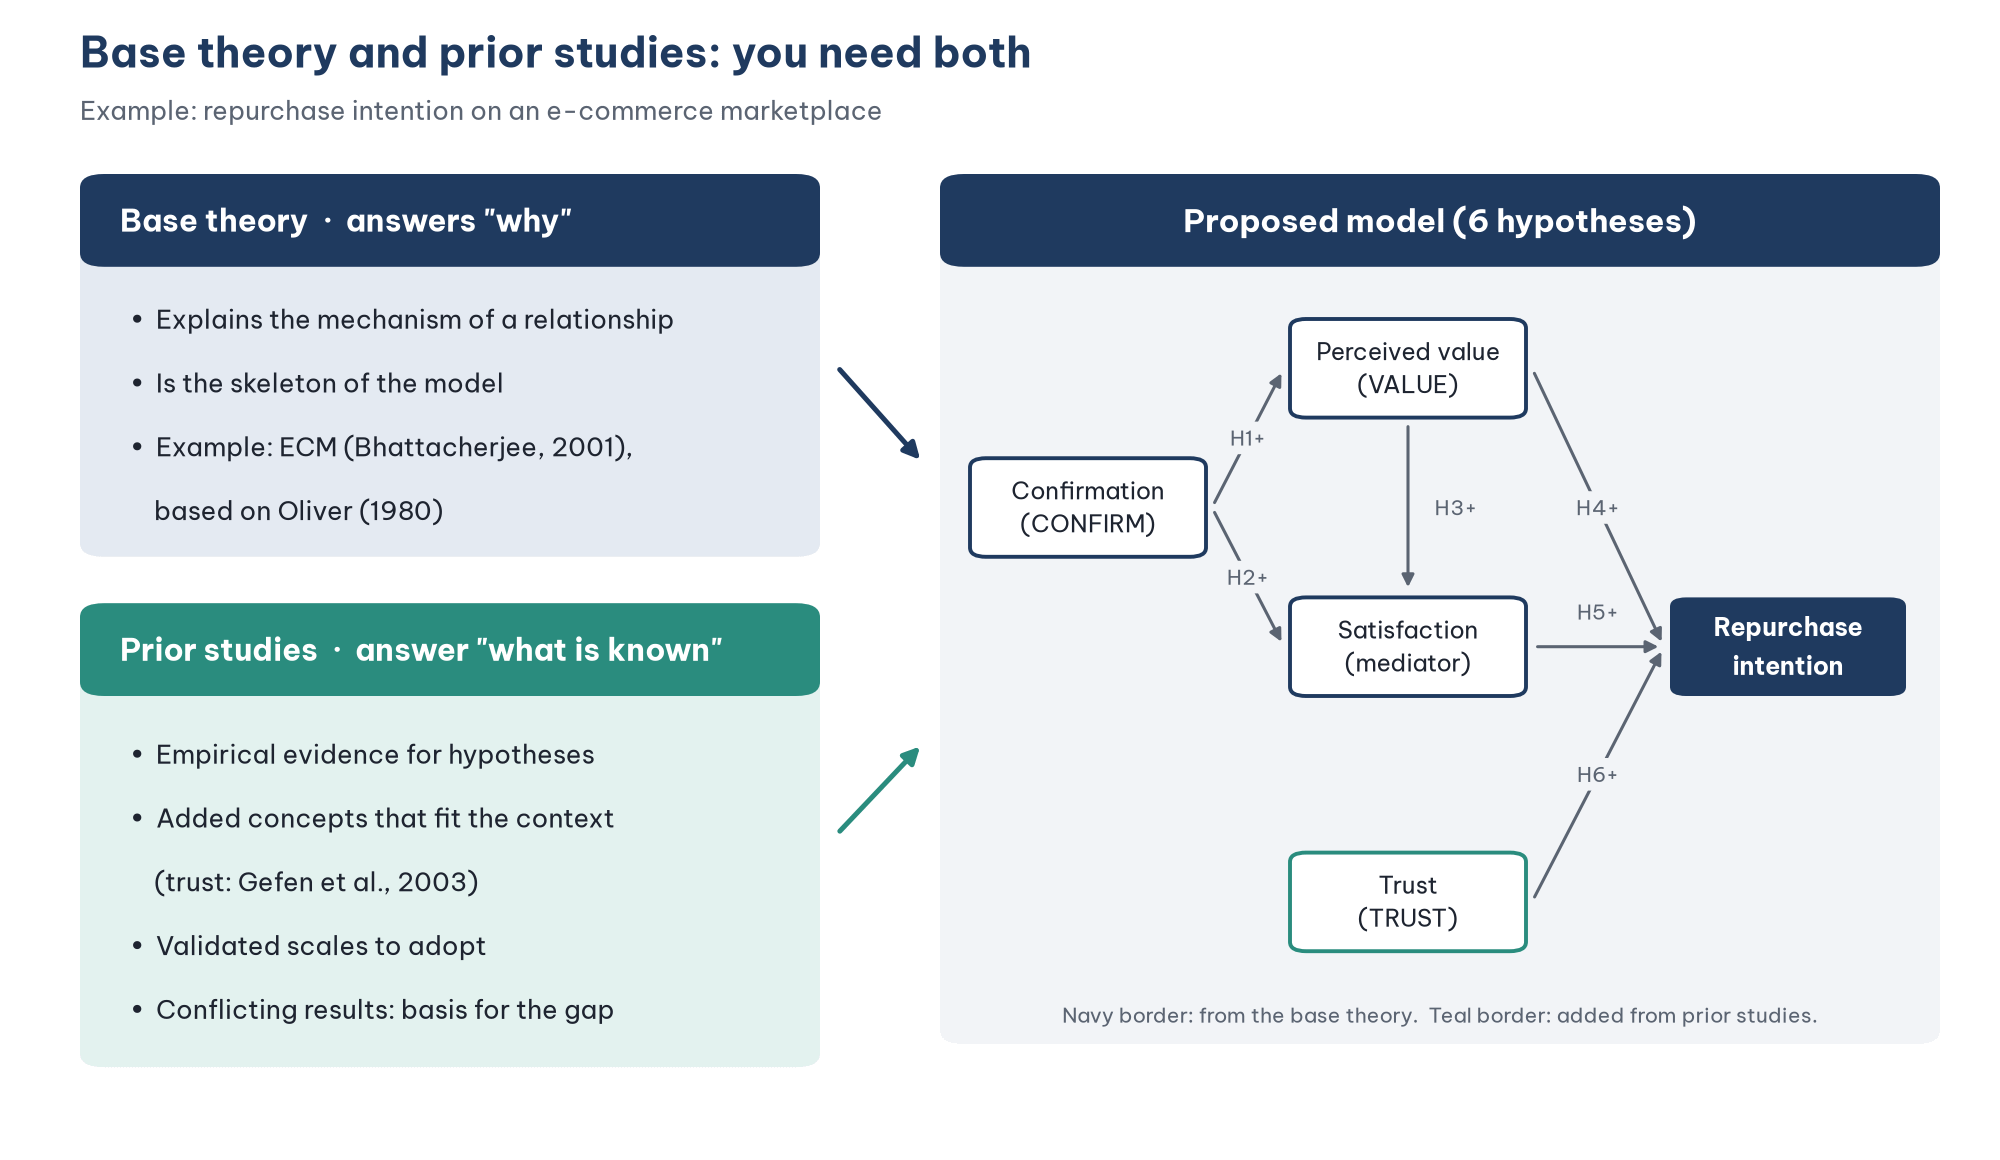
Base theory: explaining the mechanism
A base theory is a widely accepted theory that explains why concepts are related. Because the example topic studies post-purchase behavior, the appropriate base theory must be a theory about the post-adoption stage, not a theory of initial adoption:
Expectation-confirmation theory holds that satisfaction forms when consumers compare their actual experience with their initial expectations; confirmed expectations lead to satisfaction, and satisfaction leads to repurchase intention (Oliver, 1980).
The expectation-confirmation model of continuance (ECM) of Bhattacherjee (2001) develops this theory for the technology context: the degree of confirmation affects perceived usefulness and satisfaction; perceived usefulness and satisfaction together determine continuance intention. The concept of perceived usefulness comes from TAM (Davis, 1989).
The base theory is the skeleton of the model. Without it, the model is just a list of factors put together. Note too that choosing an unsuitable base theory is as dangerous as having no theory. Using TAM, a theory about the adoption of new technology, to explain the repurchase behavior of people who are already used to it is a poor fit.
Prior studies: providing evidence and tools
Prior empirical studies are articles that have tested similar relationships with data. They provide four things that the base theory does not:
Empirical evidence for each hypothesis, used as the second layer of argument in Step 3.
Additional concepts that fit the context. ECM has no trust concept, but in online shopping customers do not meet the seller and cannot hold the product before paying. Gefen et al. (2003) showed that trust in an online vendor plays an important role in the purchase intention of customers who have bought before.
Validated scales to adopt in Step 4.
Conflicting or untested results, which are the basis for confirming the gap stated in Step 1.
Prior studies are also the basis for adding concepts to the base theory. Adding trust to ECM is not an arbitrary combination, because there is a precedent: Kim et al. (2009) followed e-commerce customers over several points in time and showed that both trust and satisfaction are foundations of online loyalty. When you add a concept, you need to cite precedents like this.
How to conduct the literature review
Search systematically. A good literature review needs a transparent search and selection method, so that readers know how the sources were chosen (Snyder, 2019). Define the keywords (for example repurchase intention, continuance intention, expectation-confirmation, e-commerce satisfaction, trust) and search Scopus, Web of Science, Google Scholar and the journals relevant to your field and region. Favor peer-reviewed articles and recent studies.
Filter with clear criteria: the same or a similar dependent variable (repurchase intention, continuance intention, loyalty), the same online shopping context and quantitative data.
Synthesize by concept, not by article. Instead of summarizing article A, article B and article C in turn, build a concept matrix: each row is a study, each column is a concept or a relationship and each cell records the result (positive, negative, not statistically significant) (Webster & Watson, 2002). The matrix shows which relationships have been tested many times, which have conflicting results and which concepts have been studied little.
Stop at saturation. There is no required number. A practical sign that you can stop is when further reading no longer brings any new concept or relationship.
An example of a concept matrix, in which each cell records the effect of a concept on repurchase intention (illustrative data, not the results of an actual synthesis):
Output and checklist
Output: the presentation of the base theory, the synthesis matrix of prior studies and the paragraph that confirms the research gap.
Checklist:
The base theory matches the stage of behavior being studied (initial adoption or post-purchase).
Each concept planned for the model appears in the base theory or in at least one prior study.
The review is organized by concept, not as a list of article summaries.
The gap from Step 1 is confirmed again by the synthesis matrix.
Step 3. Build the research model and hypotheses
What to do
Use the base theory as the frame. Keep the core concepts and relationships of ECM: confirmation, perceived usefulness, satisfaction, repurchase intention. In this series, the ECM concept of perceived usefulness is named Perceived value (VALUE); its four items ask whether shopping on Marketplace X saves time, helps find good prices, makes it easy to compare products and is useful overall. The five constructs of the running example are Confirmation (CONFIRM), Perceived value (VALUE), Satisfaction (SATISF), Trust (TRUST) and Repurchase intention (INTENT).
Add concepts for a reason. Each added concept must be supported by prior studies and fit the context, for example adding trust because it is a specific condition of online transactions (Gefen et al., 2003; Kim et al., 2009).
Define each concept according to a specific source. This definition determines the scale in Step 4.
Write hypotheses with two layers of argument. Each hypothesis corresponds to one arrow in the model and needs (a) an argument from the base theory about the mechanism, and (b) evidence from prior studies. For example:
According to ECM, satisfaction with the previous experience determines whether users continue to use a system (Bhattacherjee, 2001). In the e-commerce context, Kim et al. (2009) showed that satisfaction has a positive effect on customers' online loyalty. Therefore: H5: Satisfaction has a positive effect on customers' repurchase intention on Marketplace X.
Choose the type of model and the analysis technique. A model with only direct effects on one dependent variable can be handled with regression in SPSS. A model with a mediator, a moderator or several dependent variables should use SEM (Hair, Risher, et al., 2019; Kline, 2023). The example model has satisfaction as a mediator, so it suits SEM. In this series, the model is analyzed with both CB-SEM (AMOS, with JASP as the free alternative) and PLS-SEM (SmartPLS); the SPSS/PSPP posts use the direct effects to illustrate regression. This decision directly affects the sample size in Step 4.
The example model has six hypotheses:
Output and checklist
Output: the diagram of the research model, the list of hypotheses with their arguments, the table of concept definitions and the planned analysis technique. Steps 2 and 3 together form Chapter 2.
Checklist:
Each arrow in the model has exactly one hypothesis.
Each hypothesis has both a theoretical argument and empirical evidence.
Each concept has a definition and a scale planned for adoption.
Step 4. Design the study: scales, questionnaire and sample
Choose the research design
Most quantitative theses in economics and management use a cross-sectional survey design, collecting data once from one sample at one point in time (Saunders et al., 2023). Many studies add a preliminary qualitative phase (expert interviews or focus groups) to adjust the scales before the main survey.
Develop the scales
Each concept is measured by a set of observed items, that is, the questions in the questionnaire. The recommended scale development process runs from specifying the content domain of the concept, generating or adopting items and collecting pilot data, to testing reliability and validity (Churchill, 1979; MacKenzie et al., 2011). For a thesis that adopts existing scales, the practical process has five steps:
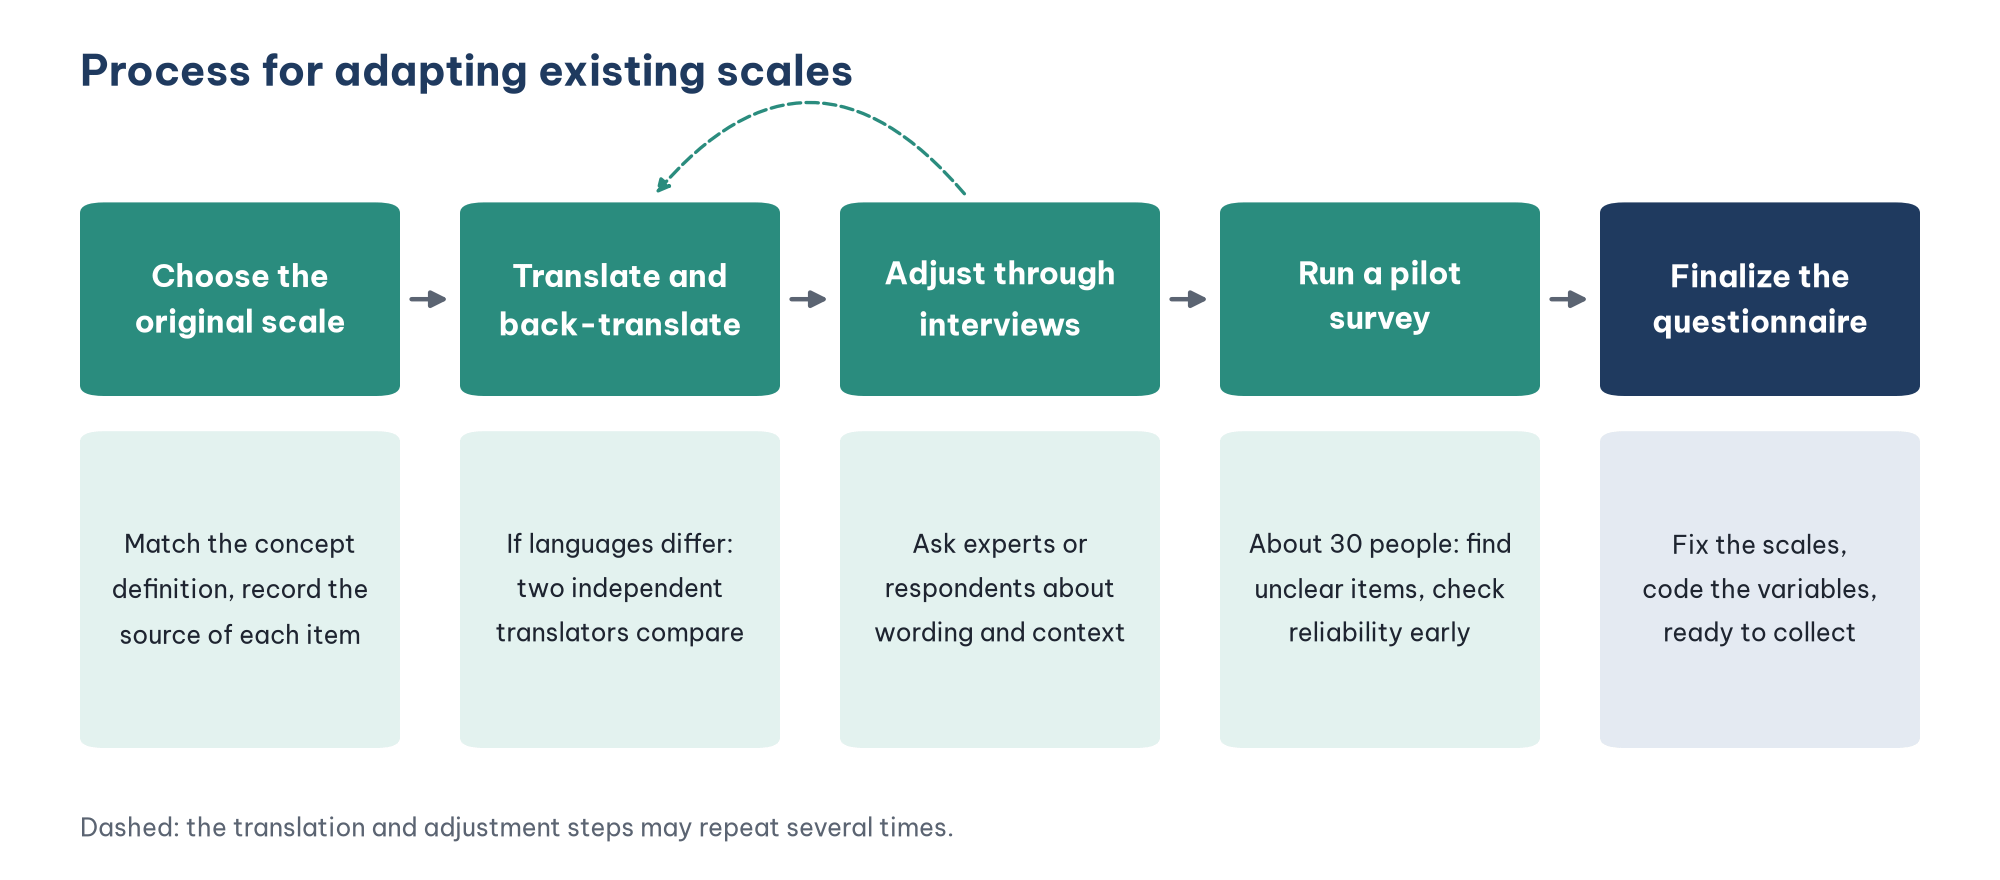
Choose the original scale that has been validated in a reputable study and matches the concept definition from Step 3, and record the source of each item.
Translate and back-translate if the respondents use a different language from the original scale: one person translates the items into the survey language, another person independently translates them back into the original language, and the two versions are compared to correct the meaning (Brislin, 1970).
Adjust through preliminary interviews with experts or with people from the target respondents, to check that the wording is easy to understand and fits the context.
Run a pilot survey to detect unclear questions and check reliability in a preliminary way. Johanson and Brooks (2010) recommend a pilot sample of at least about 30 people for scale development.
Finalize the questionnaire.
You also need to decide whether each scale is reflective or formative, because the two types are assessed with different criteria (MacKenzie et al., 2011). Most attitude and perception scales in theses are reflective, measured on 5-point or 7-point Likert scales. Likert scales are covered in Post 3, "Levels of Measurement and Likert Scales".
Design the questionnaire and prevent common method bias
A survey questionnaire usually has an introduction with a confidentiality statement, screening questions, blocks of questions that measure the concepts and a demographic section at the end.
When the independent and dependent variables are collected from the same respondent in the same questionnaire, the results may suffer from common method bias. Podsakoff et al. (2003) recommend dealing with it first through design: ensure anonymity, state clearly that there are no right or wrong answers, write short and clear questions and do not place the block of an independent variable directly before the block of the dependent variable. Statistical tests after data collection are only a supplementary step.
Design the sample
Population: customers in the chosen city or region who have bought on Marketplace X at least once in the past 6 months.
Sampling method: probability sampling allows the results to be generalized to the population; nonprobability sampling (convenience, snowball) is easier to carry out but limits generalization (Saunders et al., 2023). Many theses use convenience sampling and should say so plainly in the limitations section. If Marketplace X agrees to cooperate, a random selection from the list of past buyers gives a probability sample.
Sample size is set according to the analysis technique chosen in Step 3:
Regression and comparison tests: power analysis with G*Power (Faul et al., 2007).
EFA: at least about 100 observations, with at least 5 observations per observed item, preferably 10 (Hair, Black, et al., 2019).
PLS-SEM: the inverse square root method (Kock & Hadaya, 2018).
CB-SEM: a larger sample is needed, especially when the model has many parameters or the data are not normal (Kline, 2023).
When you use several techniques, take the largest sample size among the requirements, then distribute extra questionnaires to allow for invalid responses. Post 4, "How Large Should Your Sample Be?" covers this topic in detail.
Output and checklist
Output: the final questionnaire, a summary table of the scales (concept, item code, item wording, source) and a sampling plan with a target sample size and its calculation. This is the content of Chapter 3. After this step, you have everything for the research proposal (Steps 1 to 4 combined).
Checklist:
Each concept in the model has a scale, and each item has a source.
The questionnaire has been piloted and adjusted.
The target sample size is justified and tied to the analysis technique.
Step 5. Collect and clean the data
What to do
Collect the data with a paper or online questionnaire (Google Forms, Microsoft Forms, Qualtrics), following these practices:
Put screening questions at the start of the questionnaire to exclude people outside the population, for example: "In the past 6 months, have you bought on Marketplace X at least once?".
Add attention-check questions, for example asking respondents to select one specific option, to detect careless respondents.
Follow research ethics: state the purpose, ask for consent to participate, promise anonymity and confidentiality and allow respondents to stop at any time (Creswell & Creswell, 2023).
Record the collection process: the dates, the distribution channels, the number of questionnaires sent out and returned.
Clean the data before analysis: remove responses that fail the screening question or the attention check, remove responses that give the same answer to every item, handle missing values and check outliers. Record the number of responses removed for each reason. The detailed procedure is in Post 8, "Data Cleaning in PSPP (SPSS)", in the SPSS/PSPP part of the series.
Output and checklist
Output: a clean, coded data file and a summary table of the collection process (questionnaires sent out, returned, removed for each reason, valid).
Checklist:
The number of valid responses reaches or exceeds the target sample size from Step 4.
Each removed response has a recorded reason.
Step 6. Analyze the data and test the hypotheses
What to do
Describe the characteristics of the sample and the means of the observed items.
Assess the scales for reliability and validity.
Test the model and the hypotheses, including direct effects and indirect effects through the mediator.
Run additional analyses (if any): comparisons between customer groups, control variables, common method bias.
The specific techniques for points 2 and 3 depend on the type of model chosen in Step 3 of the process:
Each technique in the table has its own tutorial in the series, with illustrative numbers from the example study.
Output and checklist
Output: the result tables and the conclusion to support or reject each hypothesis. Step 5 (collection results, sample description) and Step 6 form Chapter 4.
Checklist:
The scales meet the assessment thresholds before the hypotheses are tested.
Each hypothesis has a clear conclusion with numbers: coefficient, p-value and effect size.
Step 7. Discuss the results and write the report
What to do
Answer each research question set in Step 1, based on the test results.
Report fully: not only the p-value but also the effect size and, where possible, the confidence interval (American Psychological Association, 2020).
Discuss: compare the results with the studies in the synthesis matrix from Step 2, and explain why the results are similar or different, especially for rejected hypotheses.
Draw implications: theoretical implications (what the study contributes to ECM in the e-commerce context studied) and managerial implications (what Marketplace X should improve first to retain customers).
State the limitations and directions for future research: a convenience sample, a cross-sectional design, measuring repurchase intention rather than actual repurchase behavior.
Output and checklist
Output: Chapter 5 and the complete thesis.
Checklist:
Each research question from Step 1 has an answer.
Each result is compared with at least one prior study.
Each managerial implication comes from a specific result and addresses the practical problem stated in Step 1.
How the 7 steps map to the thesis chapters
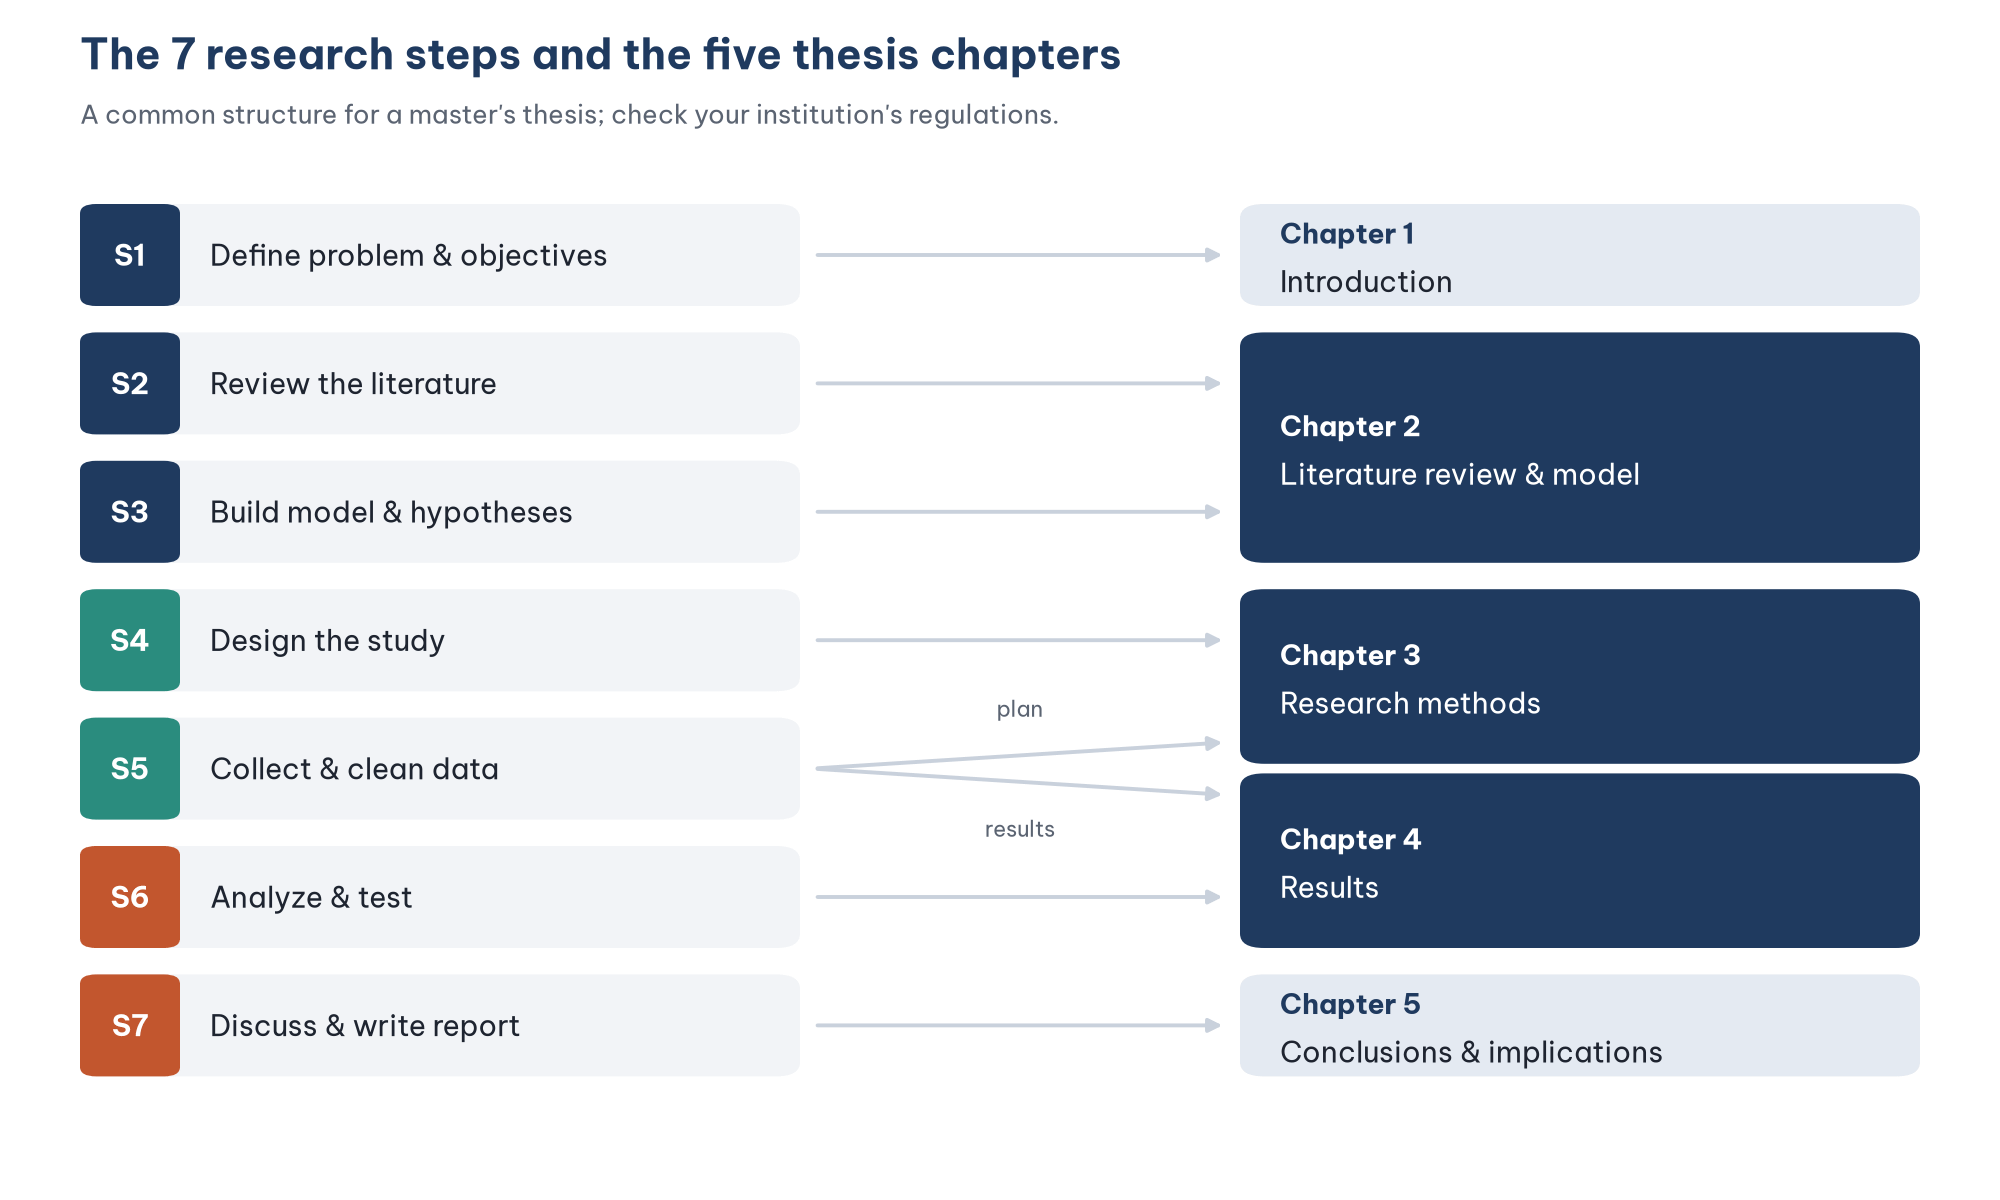
Figure 5 shows how the 7 steps map to a common five-chapter structure of a master's thesis. The exact structure differs between institutions, so check your institution's regulations.
Nine common mistakes
Choosing a topic with no practical problem. For example, studying online shopping intention when almost everyone already shops online. Start from a situation that needs improving.
Confusing the symptom with the research problem. "Customers rarely come back" is already known; the research problem is what is not yet known, for example which factors cause it and to what extent.
Using preliminary data to conclude the cause. Preliminary data only prove that a problem exists; the cause must be tested by the main study.
Relying only on the base theory without reviewing prior studies. The hypotheses lack empirical evidence and the gap is not demonstrated.
Choosing a base theory that does not match the stage of behavior, for example using a technology acceptance theory to explain repurchase behavior.
Combining factors from many studies without a base theory as the frame. The model becomes a list of factors with no explanatory mechanism.
Writing the literature review as a series of article summaries. Readers cannot see the overall picture or the gap.
Collecting data before the model is final, or choosing the analysis technique after the data are in. A questionnaire that lacks a variable cannot be completed afterwards, and the sample may be too small for the technique you need.
Reporting only p-values. Effect sizes and a discussion that compares the results with prior studies are missing.
Frequently asked questions
Where can I get practical evidence without internal company data?
You can use industry reports, official statistics, public customer reviews on online platforms or run a small round of interviews or a small survey yourself. When you present the data, state the source, the date and the size of the data.
How is a base theory different from a research model?
A base theory is an accepted general theory, such as ECM. The research model is the specific version you propose for your topic: you use the base theory as the frame, then add or adjust concepts based on prior studies and the context, as with adding trust in the example topic.
How many prior studies should I read?
There is no required number. What matters is that every concept and every hypothesis is supported, and that you stop when further reading no longer brings new concepts or relationships.
Is a preliminary qualitative study required?
Not at every institution, but it is strongly recommended when the scales are translated from another language or when the research context differs a lot from the original studies. This step helps you defend the content validity of your scales to your examiners.
Can I use the same data for EFA and CFA?
Yes, and this is common practice in theses, but you should state it as a limitation. A more rigorous approach is to split the sample into two parts: one part for EFA and the other for CFA.
References
American Psychological Association. (2020). Publication manual of the American Psychological Association (7th ed.). https://doi.org/10.1037/0000165-000
Bhattacherjee, A. (2001). Understanding information systems continuance: An expectation-confirmation model. MIS Quarterly, 25(3), 351–370. https://doi.org/10.2307/3250921
Bougie, R., & Sekaran, U. (2019). Research methods for business: A skill-building approach (8th ed.). Wiley.
Brislin, R. W. (1970). Back-translation for cross-cultural research. Journal of Cross-Cultural Psychology, 1(3), 185–216. https://doi.org/10.1177/135910457000100301
Churchill, G. A., Jr. (1979). A paradigm for developing better measures of marketing constructs. Journal of Marketing Research, 16(1), 64–73. https://doi.org/10.1177/002224377901600110
Creswell, J. W., & Creswell, J. D. (2023). Research design: Qualitative, quantitative, and mixed methods approaches (6th ed.). SAGE Publications.
Davis, F. D. (1989). Perceived usefulness, perceived ease of use, and user acceptance of information technology. MIS Quarterly, 13(3), 319–340. https://doi.org/10.2307/249008
Faul, F., Erdfelder, E., Lang, A.-G., & Buchner, A. (2007). G*Power 3: A flexible statistical power analysis program for the social, behavioral, and biomedical sciences. Behavior Research Methods, 39(2), 175–191. https://doi.org/10.3758/BF03193146
Gefen, D., Karahanna, E., & Straub, D. W. (2003). Trust and TAM in online shopping: An integrated model. MIS Quarterly, 27(1), 51–90. https://doi.org/10.2307/30036519
Hair, J. F., Black, W. C., Babin, B. J., & Anderson, R. E. (2019). Multivariate data analysis (8th ed.). Cengage Learning.
Hair, J. F., Risher, J. J., Sarstedt, M., & Ringle, C. M. (2019). When to use and how to report the results of PLS-SEM. European Business Review, 31(1), 2–24. https://doi.org/10.1108/EBR-11-2018-0203
Johanson, G. A., & Brooks, G. P. (2010). Initial scale development: Sample size for pilot studies. Educational and Psychological Measurement, 70(3), 394–400. https://doi.org/10.1177/0013164409355692
Kim, D. J., Ferrin, D. L., & Rao, H. R. (2009). Trust and satisfaction, two stepping stones for successful e-commerce relationships: A longitudinal exploration. Information Systems Research, 20(2), 237–257. https://doi.org/10.1287/isre.1080.0188
Kline, R. B. (2023). Principles and practice of structural equation modeling (5th ed.). Guilford Press.
Kock, N., & Hadaya, P. (2018). Minimum sample size estimation in PLS-SEM: The inverse square root and gamma-exponential methods. Information Systems Journal, 28(1), 227–261. https://doi.org/10.1111/isj.12131
MacKenzie, S. B., Podsakoff, P. M., & Podsakoff, N. P. (2011). Construct measurement and validation procedures in MIS and behavioral research: Integrating new and existing techniques. MIS Quarterly, 35(2), 293–334. https://doi.org/10.2307/23044045
Oliver, R. L. (1980). A cognitive model of the antecedents and consequences of satisfaction decisions. Journal of Marketing Research, 17(4), 460–469. https://doi.org/10.1177/002224378001700405
Podsakoff, P. M., MacKenzie, S. B., Lee, J.-Y., & Podsakoff, N. P. (2003). Common method biases in behavioral research: A critical review of the literature and recommended remedies. Journal of Applied Psychology, 88(5), 879–903. https://doi.org/10.1037/0021-9010.88.5.879
Saunders, M. N. K., Lewis, P., & Thornhill, A. (2023). Research methods for business students (9th ed.). Pearson.
Snyder, H. (2019). Literature review as a research methodology: An overview and guidelines. Journal of Business Research, 104, 333–339. https://doi.org/10.1016/j.jbusres.2019.07.039
Webster, J., & Watson, R. T. (2002). Analyzing the past to prepare for the future: Writing a literature review. MIS Quarterly, 26(2), xiii–xxiii.
Discussion about this post