Discriminant Validity in SmartPLS 4 with HTMT and Fornell-Larcker
Read the HTMT matrix against the 0.85 and 0.90 thresholds with bootstrap intervals, and see why Fornell-Larcker and cross loadings rarely fail in PLS-SEM


Key takeaways
In PLS-SEM, HTMT is the main criterion for discriminant validity; the Fornell-Larcker criterion and cross loadings are supplementary information.
HTMT should be below 0.85 for clearly distinct concepts and below 0.90 for concepts close in theory; a stricter test requires the 95th bootstrap percentile to stay below the threshold.
On the Marketplace X data the highest HTMT is 0.661 (Value and Satisfaction), with a 95th percentile of 0.738, so every pair has discriminant validity.
The Fornell-Larcker criterion is easy to pass in PLS-SEM, because the square root of the AVE is inflated and the latent correlations are deflated.
When HTMT exceeds the threshold, check the theory and the item content before merging constructs; do not drop items just to push HTMT down.
Post 34 showed that the five scales of the Marketplace X model are reliable and have convergent validity. The last step in assessing the measurement model is discriminant validity: does each scale measure a concept that is different from the other scales? For the Marketplace X study, the pair that raises the most concern is Perceived value and Satisfaction, two concepts that are closely related in theory.
Post 25 introduced HTMT and the Fornell-Larcker criterion in CB-SEM. This post focuses on how to read the three discriminant validity tables in SmartPLS, and on why, in PLS-SEM, HTMT is the main criterion, while the Fornell-Larcker criterion and cross loadings serve only as supplementary information.
Sample data and scripts. The data file and scripts for this post are in the research-data-analysis repository on GitHub (folder
data/andscripts/). Download the whole repository with Code > Download ZIP.
About the figures and numbers. All figures are real screenshots of the SmartPLS 4.1.2.1 report (Ringle et al., 2026; 30-day trial), taken in November 2026, for the model
marketplace-x-modelof Post 33, with casewise deletion, 254 respondents. Every number was cross-checked in R with the scriptdiscriminant_validity.R(in the repository'sscripts/folder) and matches SmartPLS to the third decimal place. The bootstrap confidence intervals of HTMT were computed in R with 5,000 samples. SmartPLS lists the constructs alphabetically (CONFIRM, INTENT, SATISF, TRUST, VALUE), so the rows and columns of its tables follow that order.
1. Open the discriminant validity tables
In the report of the PLS-SEM algorithm (Post 33, Section 6), expand the Quality criteria group, then click the arrow next to Discriminant validity. This entry has six options:
Heterotrait-monotrait ratio (HTMT), shown in three forms: Matrix, List (one row per pair) and Bar chart.
Congruence coefficient: another index, not used in this series.
Fornell-Larcker criterion.
Cross loadings.
2. HTMT: the main criterion
HTMT (Henseler et al., 2015) compares the correlations between items of two different scales with the correlations between items within the same scale. An HTMT close to 1 means that the items of the two scales correlate almost as strongly with each other as items within one scale: the two scales are hard to tell apart. Post 25 explains the calculation in detail.
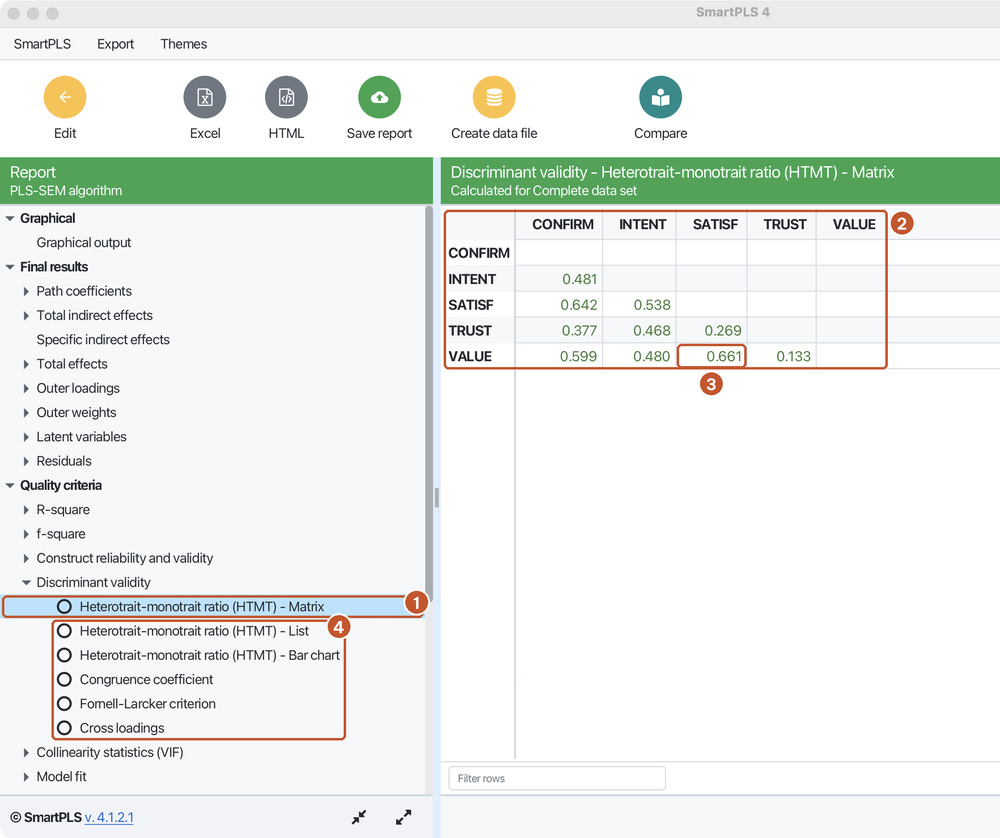
Step 1. Select Heterotrait-monotrait ratio (HTMT) - Matrix (Figure 1).
Thresholds (Henseler et al., 2015):
Below 0.85 for concepts that are clearly distinct in theory.
Below 0.90 for concepts that are close in theory, such as Perceived value and Satisfaction.
A stricter approach tests whether HTMT is significantly lower than the threshold, using a bootstrap confidence interval: the upper bound of the one-sided 95% confidence interval (the 95th percentile) must be lower than the threshold (Franke & Sarstedt, 2019; Hair et al., 2019).
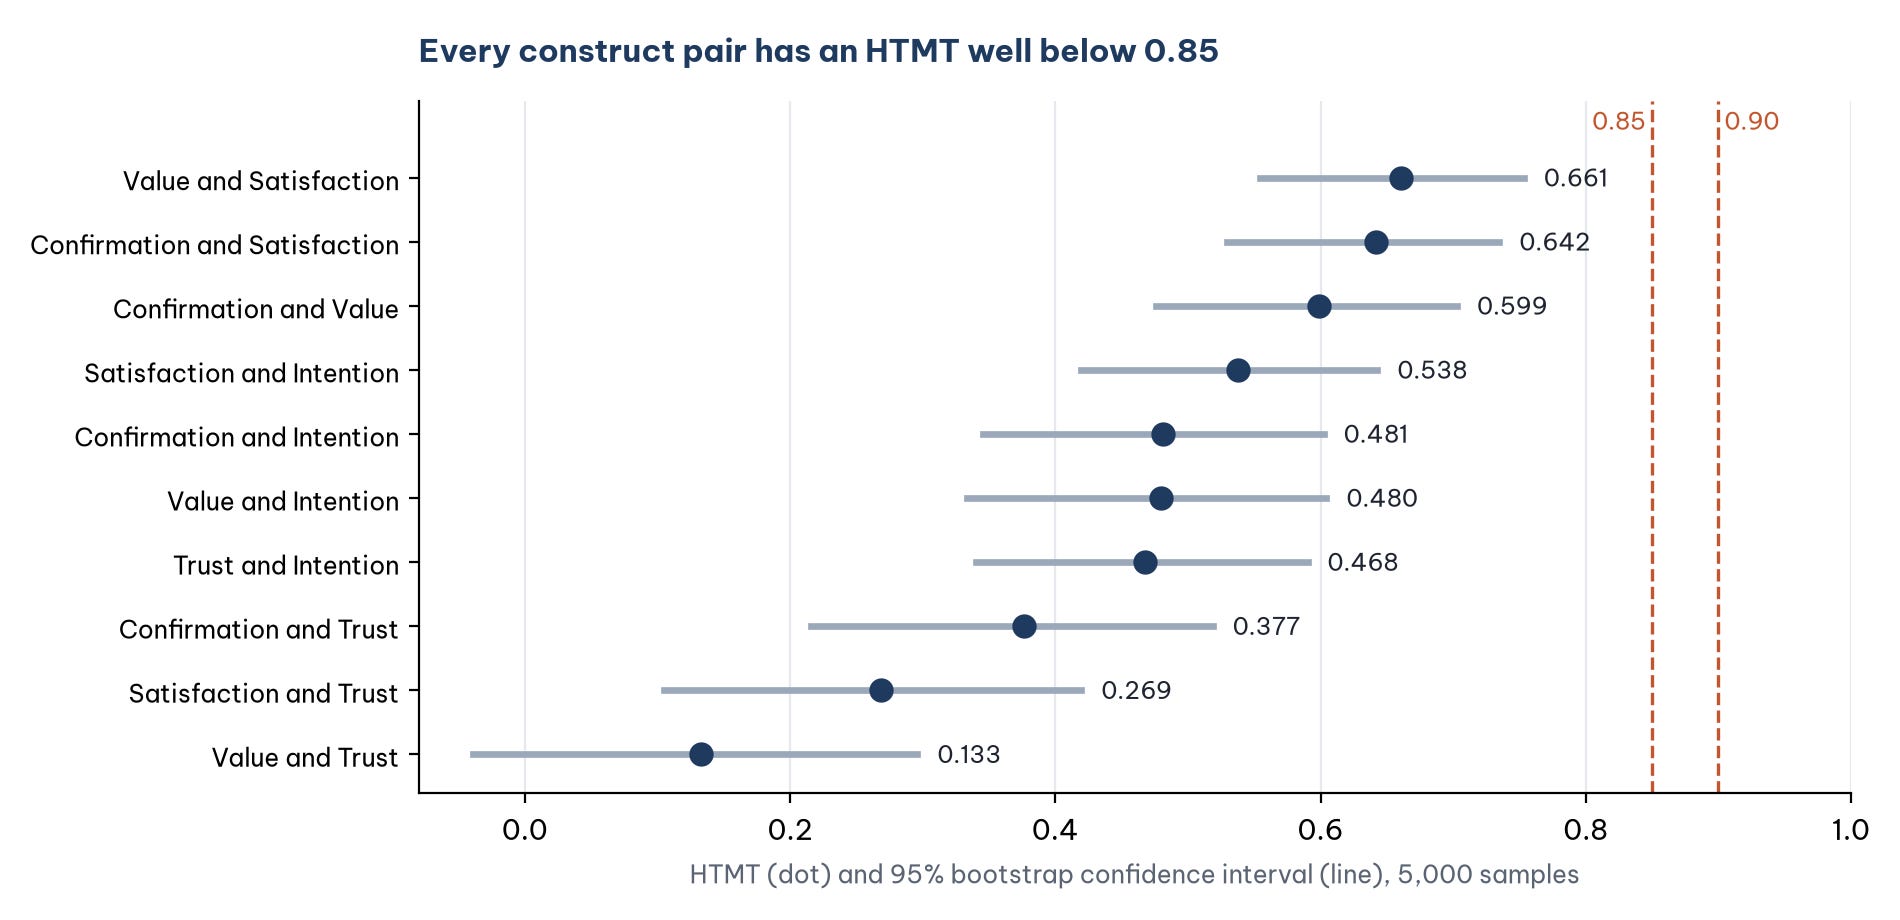
Result: the highest HTMT is 0.661 (Value and Satisfaction), with a 95th percentile of 0.738, both far below the 0.85 threshold. Every construct pair has discriminant validity. The result is close to Post 25 (0.653 for the same pair); the small difference arises because Post 25 used 267 respondents with pairwise correlations.
HTMT depends only on the correlations between the items, not on how the model is estimated. HTMT in SmartPLS, JASP or R therefore gives the same result on the same data, and it is not biased the way AVE is (Post 34).
Post 39 explains how bootstrapping works inside SmartPLS and how to read its confidence intervals.
3. The Fornell-Larcker criterion
Fornell and Larcker (1981): a construct has discriminant validity when the square root of its AVE is greater than its correlation with every other construct.
Step 2. Select Fornell-Larcker criterion (Figure 3). The diagonal shows the square root of the AVE; the other cells are the correlations between two latent variables.
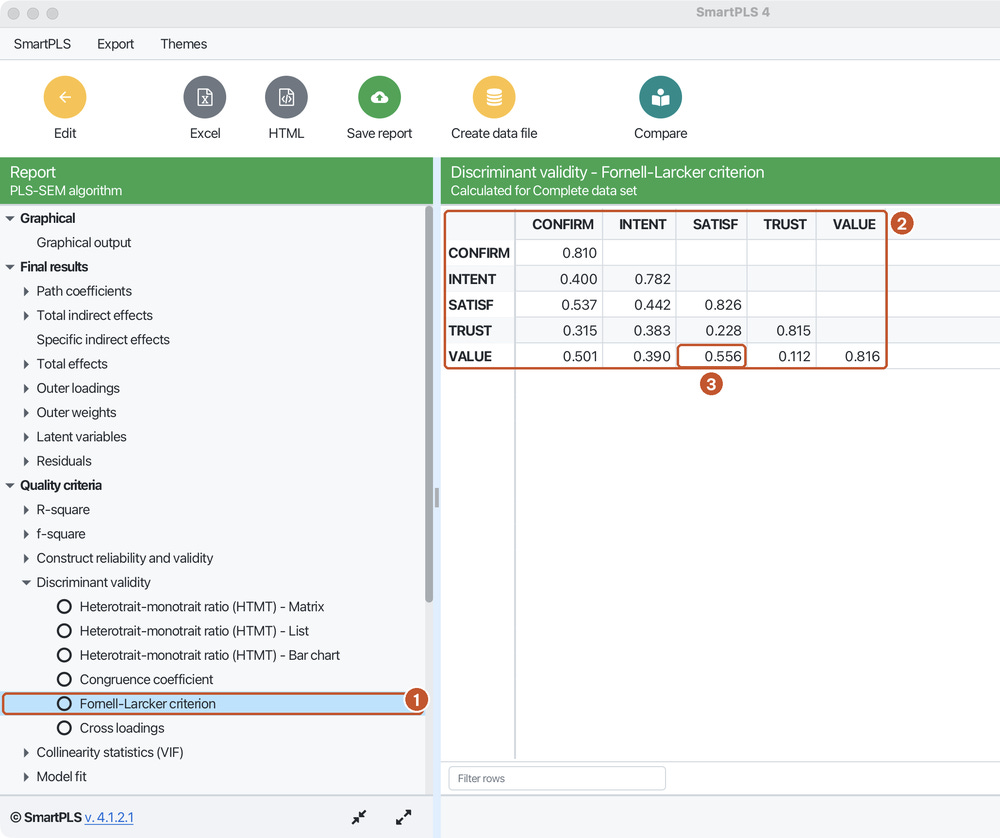
Result: the square roots of the AVE range from 0.782 (Intention) to 0.826 (Satisfaction), all greater than the highest correlation, 0.556 (Value and Satisfaction). The criterion is met.
Why not rely on the Fornell-Larcker criterion in PLS-SEM? In PLS-SEM, this criterion is biased towards "easy to pass" from both ends:
The square root of the AVE is inflated, because the loadings are inflated (Post 34).
The correlations between latent variables are deflated, because composites contain measurement error (Post 31).
The simulations of Henseler et al. (2015) show that the Fornell-Larcker criterion often fails to detect a lack of discriminant validity between two concepts. Hair et al. (2019) therefore recommend HTMT instead of the Fornell-Larcker criterion. Many thesis committees still ask for the Fornell-Larcker table; you can report it alongside, but base your conclusion on HTMT.
4. Cross loadings
Cross loadings are the correlations of each item with the scores of every latent variable. The requirement: each item correlates more strongly with its own construct than with any other construct.
Step 3. Select Cross loadings (Figure 4). If the table does not show all 20 rows, drag the zoom slider in the bottom-right corner to shrink the table.
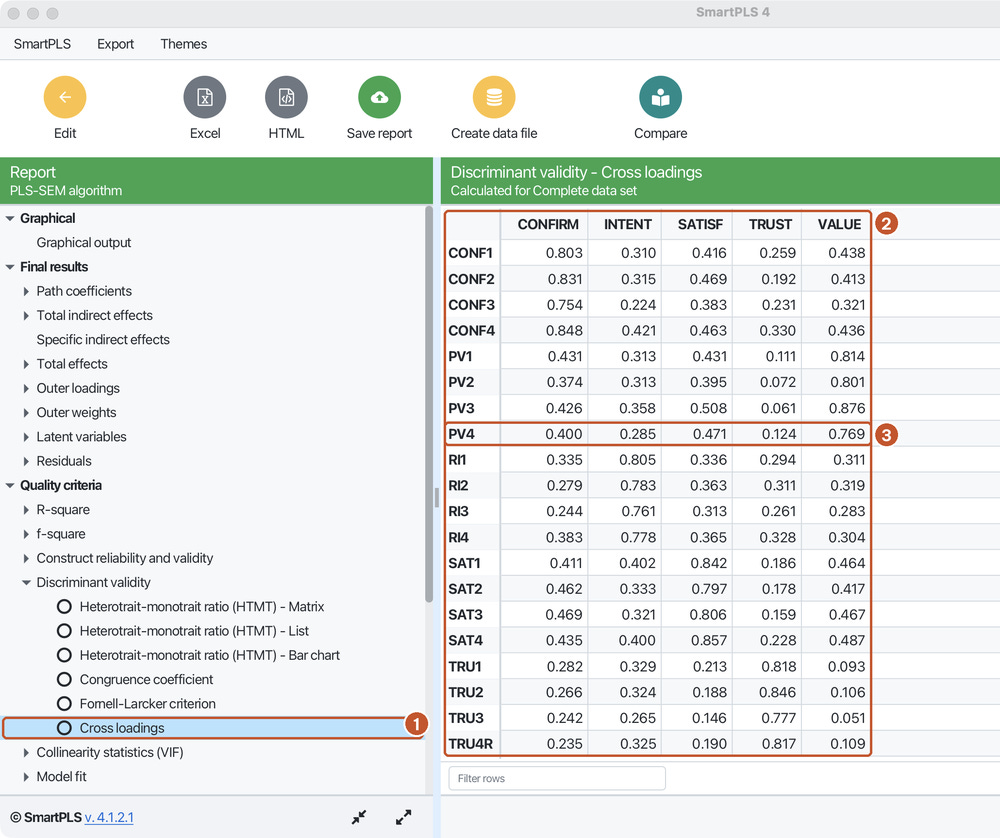
Result: every item has its highest loading on its own construct. The smallest gap is item PV4: 0.769 on Value versus 0.471 on Satisfaction, a difference of 0.298. The criterion is met.
As with the Fornell-Larcker criterion, cross loadings very rarely detect discriminant validity problems in PLS-SEM (Henseler et al., 2015), so use them only as supplementary information: if an item has a higher cross loading than its own loading, that is a clear sign that the content of the item needs another look.
5. What to do when HTMT exceeds the threshold
The Marketplace X data do not have this problem, but when the HTMT of a pair exceeds 0.85 or 0.90, consider the following, in order:
Check the theory: are the two concepts really different, or are they two names for the same concept?
Look at the cross loadings to find items that correlate highly with the other construct. Items with overlapping content are candidates for review.
Consider merging the two constructs if theory allows it, then compare the models (Post 23 tried this with Value and Satisfaction in CB-SEM).
Do not drop items just to push HTMT below the threshold without considering their content.
6. Reporting the results
Discriminant validity was assessed with the HTMT ratio (Henseler et al., 2015). The HTMT values of the ten construct pairs ranged from 0.133 to 0.661, all below the conservative threshold of 0.85. Bootstrap confidence intervals (5,000 samples) showed that the 95th percentile of the highest HTMT (Perceived value and Satisfaction) was 0.738, lower than 0.85 (Franke & Sarstedt, 2019). The Fornell-Larcker criterion and the cross loadings led to the same conclusion. The scales have discriminant validity.
The table should present the HTMT matrix (as in Figure 1), with a column of confidence intervals for the pairs with the highest HTMT.
Four common mistakes
Reporting only the Fornell-Larcker criterion in a study that uses PLS-SEM. This criterion is easy to pass and misses problems.
Using the 0.90 threshold for every pair to "be safe". The 0.90 threshold is only for concepts that are close in theory; state the reason when you use it.
Misreading the upper half of the matrix. SmartPLS fills in only the lower half; an empty cell does not mean zero.
Using HTMT for formative scales. HTMT is for reflective scales (Post 36 discusses formative scales).
Frequently asked questions
Is HTMT in SmartPLS the same as in JASP (Post 25)?
SmartPLS uses the original HTMT of Henseler et al. (2015). JASP uses HTMT2, a variant that uses the geometric mean instead of the arithmetic mean (Post 25). The two usually differ very little.
Do I need to run bootstrapping to report HTMT?
It is advisable. Comparing HTMT with the threshold is enough for a preliminary conclusion, but the confidence interval shows whether the conclusion holds up against sampling variation (Franke & Sarstedt, 2019). For the Marketplace X data, both approaches give the same conclusion.
Value and Satisfaction correlate at 0.556. Is that high?
The two concepts are related in theory (perceived value increases satisfaction, hypothesis H3), so a moderate correlation is reasonable. What needs checking is whether the two scales measure the same thing, and an HTMT of 0.661 shows that they do not.
References
Fornell, C., & Larcker, D. F. (1981). Evaluating structural equation models with unobservable variables and measurement error. Journal of Marketing Research, 18(1), 39–50. https://doi.org/10.2307/3151312
Franke, G., & Sarstedt, M. (2019). Heuristics versus statistics in discriminant validity testing: A comparison of four procedures. Internet Research, 29(3), 430–447. https://doi.org/10.1108/IntR-12-2017-0515
Hair, J. F., Risher, J. J., Sarstedt, M., & Ringle, C. M. (2019). When to use and how to report the results of PLS-SEM. European Business Review, 31(1), 2–24. https://doi.org/10.1108/EBR-11-2018-0203
Henseler, J., Ringle, C. M., & Sarstedt, M. (2015). A new criterion for assessing discriminant validity in variance-based structural equation modeling. Journal of the Academy of Marketing Science, 43(1), 115–135. https://doi.org/10.1007/s11747-014-0403-8
Ringle, C. M., Wende, S., & Becker, J.-M. (2026). SmartPLS 4 (Version 4.1.2.1) [Computer software]. SmartPLS GmbH. https://www.smartpls.com
Discussion about this post