Bootstrapping in SmartPLS 4: Testing the Significance of the Paths
Set up bootstrapping, read t values, p values and percentile confidence intervals, and decide which PLS-SEM hypotheses are supported


Key takeaways
PLS-SEM has no formula for standard errors, so it estimates them from bootstrap subsamples drawn with replacement; 5000 subsamples is the usual number.
Use percentile confidence intervals, a two-tailed test at 0.05 and Fixed seed, and report these settings with the results.
A path is significant when its 95% interval excludes 0; in the Marketplace X model six of seven hypotheses are supported and H4 is not (t = 1.721, p = 0.085).
Report the Original sample (O) coefficient, not the bootstrap mean, and write p < 0.001 rather than p = 0.000.
Choose one- or two-tailed tests before seeing the results; switching afterwards to rescue H4 is methodologically wrong.
Posts 37 and 38 assessed collinearity, R², f² and the predictive power of the Marketplace X model. The question that remains is the most important one in a thesis: are hypotheses H1 to H7 supported? To answer it, you need to know whether each path coefficient is significantly different from 0. In PLS-SEM this is done with bootstrapping, step 2 of the structural model assessment procedure of Hair et al. (2019).
Sample data and scripts. The data file and scripts for this post are in the research-data-analysis repository on GitHub (folder
data/andscripts/). Download the whole repository with Code > Download ZIP.
About the figures and numbers. The figures are real screenshots of SmartPLS 4.1.2.1 (Ringle et al., 2026; 30-day trial) for the model
marketplace-x-modelfrom Post 33, with casewise deletion on 254 respondents. The numbers in this post come from the SmartPLS report. Section 5 compares them with R (scriptbootstrap.Rin the repository'sscripts/folder, package cSEM). Bootstrapping is available with the Student license, but that license accepts at most 100 rows of data. SmartPLS lists paths in alphabetical order (CONFIRM -> INTENT first), so the order of the rows in the report differs from the order of the hypotheses.
1. What is bootstrapping?
CB-SEM (AMOS, lavaan) computes standard errors with a formula that assumes normally distributed data. PLS-SEM makes no such assumption, so it has no formula for the standard errors. Instead, the standard errors are estimated empirically:
Draw 254 respondents at random, with replacement, from the 254 respondents of the original sample. One respondent can be drawn several times, another not at all. This is one bootstrap subsample.
Estimate the model again on that subsample and record the seven path coefficients.
Repeat steps 1 and 2 many times, for example 5000 times.
Compute the standard deviation of the 5000 coefficients. This is the standard error of the coefficient.
Take the 2.5% and 97.5% cut-offs of the 5000 coefficients as the 95% confidence interval (percentile confidence interval).
A coefficient is significant at the 5% level when its 95% confidence interval does not contain 0. Equivalently, t = coefficient / standard error is larger than 1.96 (two-tailed test), or p is smaller than 0.05.
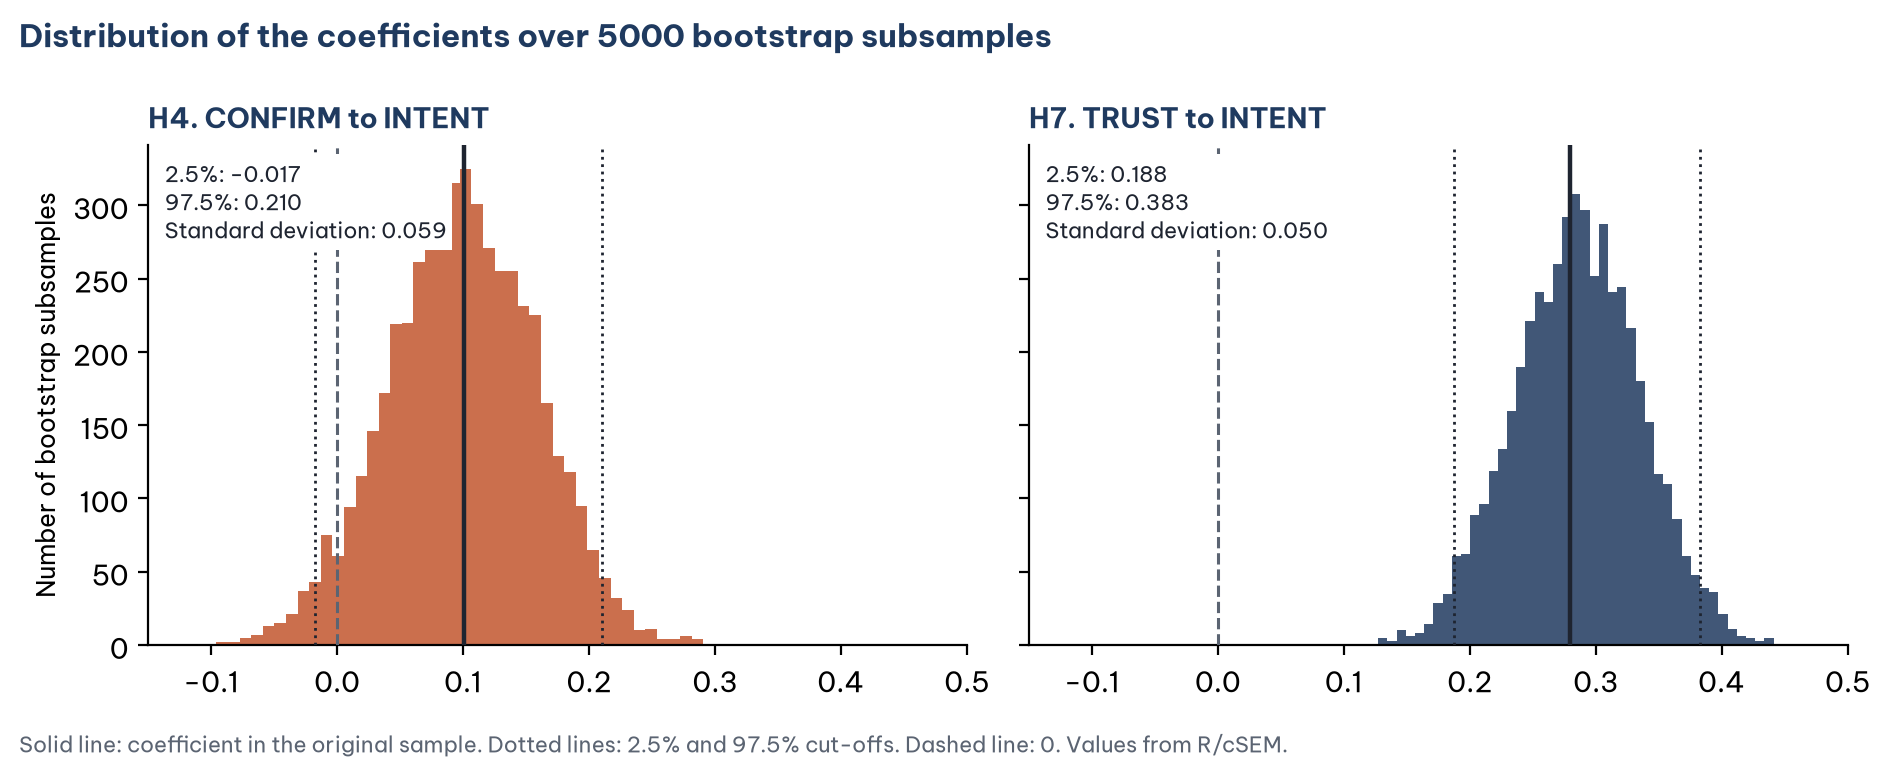
bootstrap.R). For H4, the range between the two dotted lines contains 0; for H7, it lies entirely to the right of 0.Figure 1 shows the difference between a non-significant path and a significant one. For H4, 4.8% of the bootstrap subsamples (240 of 5000) give a negative coefficient, so the possibility that the true coefficient is 0 cannot be ruled out. For H7, even the smallest coefficient among the 5000 subsamples is 0.105, far from 0.
2. Running bootstrapping in SmartPLS 4
Step 1. Open the model marketplace-x-model in the project Marketplace X. Choose Calculate > Bootstrapping.
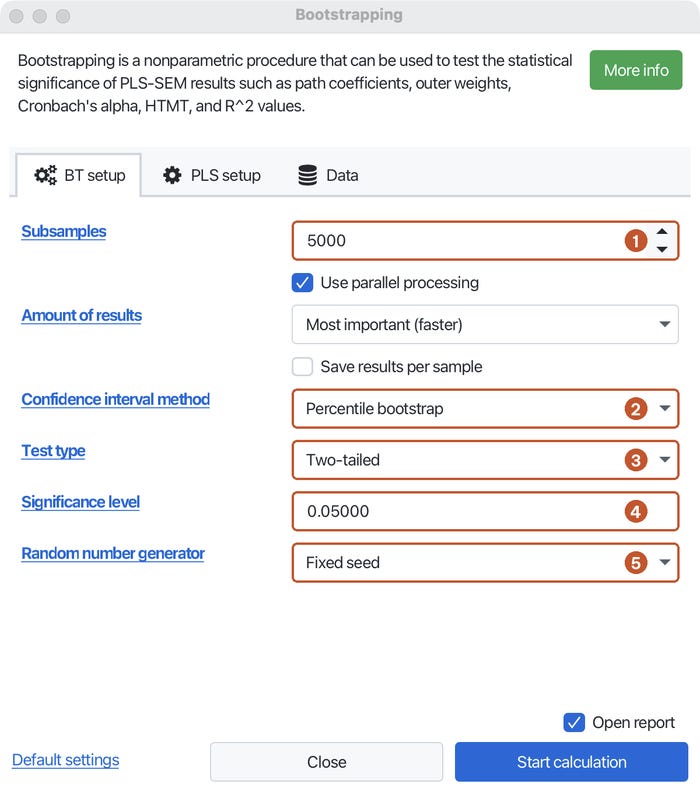
Step 2. On the BT setup tab, check five settings (Figure 2):
Subsamples: 5000, the number of bootstrap subsamples. This is the usual number in PLS-SEM research. You can increase it to 10000 for the final results so that p values and confidence intervals are more stable (Streukens & Leroi-Werelds, 2016), but the calculation takes longer.
Confidence interval method: Percentile bootstrap. Percentile confidence intervals are recommended for PLS-SEM (Aguirre-Urreta & Rönkkö, 2018; Hair et al., 2022).
Test type: Two-tailed (see section 4).
Significance level: 0.05.
Random number generator: Fixed seed, so that running it again gives the same results.
Keep Amount of results at Most important (faster): the report still contains all the tables used in this post and in Post 40.
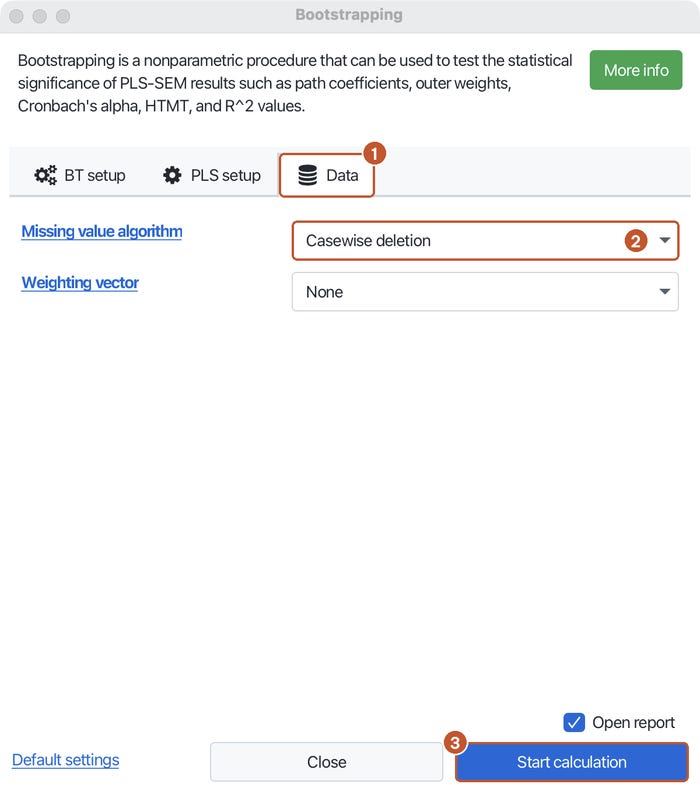
Step 3. Open the Data tab, set Missing value algorithm to Casewise deletion, then click Start calculation (Figure 3). Keep the PLS setup tab as for the PLS-SEM algorithm in Post 33 (Path weighting scheme).
With 5000 subsamples, SmartPLS estimates the model 5000 times. On a Mac with Apple silicon this takes from a few seconds to a few tens of seconds.
3. Reading the results
p values on the diagram
Step 4. The report opens at Graphical output (Figure 4). In the Graphical output pane at the bottom left, set Structural model to P values so that each path shows its p value.
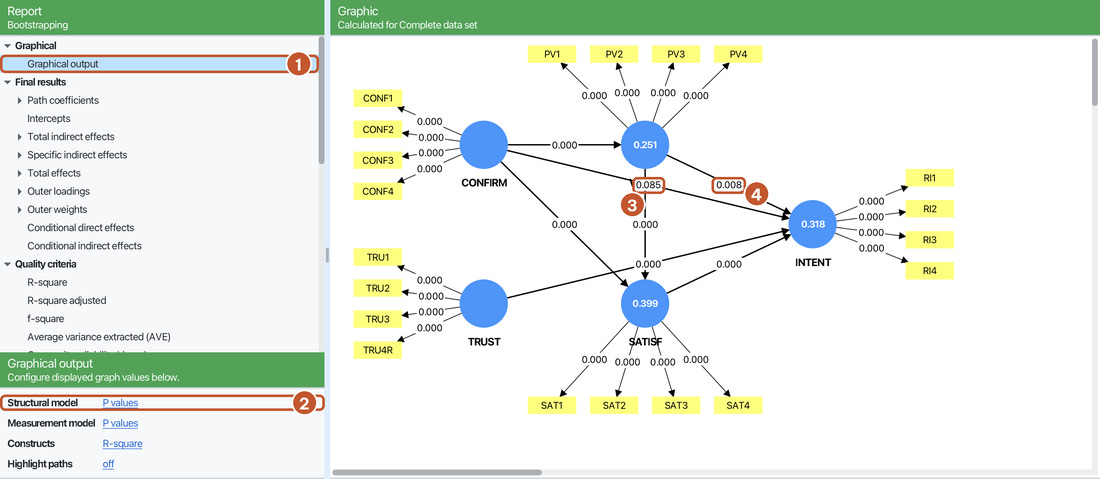
The diagram gives a quick overview, but some labels overlap (the label 0.085 covers the name VALUE, so that construct appears without a name). When writing up, read the numbers from the tables.
Path coefficient table
Step 5. Open Final results > Path coefficients > Mean, STDEV, T values, p values (Figure 5).

The columns mean:
Original sample (O): the coefficient estimated on the original sample; this is the coefficient to report.
Sample mean (M): the mean of the 5000 bootstrap coefficients. M close to O shows that the bootstrap distribution is not strongly shifted away from the original coefficient.
Standard deviation (STDEV): the standard deviation of the 5000 coefficients, that is, the standard error.
T statistics (|O/STDEV|): the absolute value of O divided by STDEV.
P values: the p value that corresponds to t.
Hand calculation of the t value of H7 (TRUST to INTENT): t = 0.2805 / 0.0501 = 5.60. SmartPLS reports 5.598 because it uses the unrounded coefficient and standard deviation.
Confidence intervals
Step 6. Open Path coefficients > Confidence intervals (Figure 6). The columns 2.5% and 97.5% are the lower and upper limits of the 95% percentile confidence interval.

The item Bias-corrected confidence intervals just below gives intervals corrected for bias. This post uses the percentile intervals chosen in Step 2.
Conclusions for the seven hypotheses
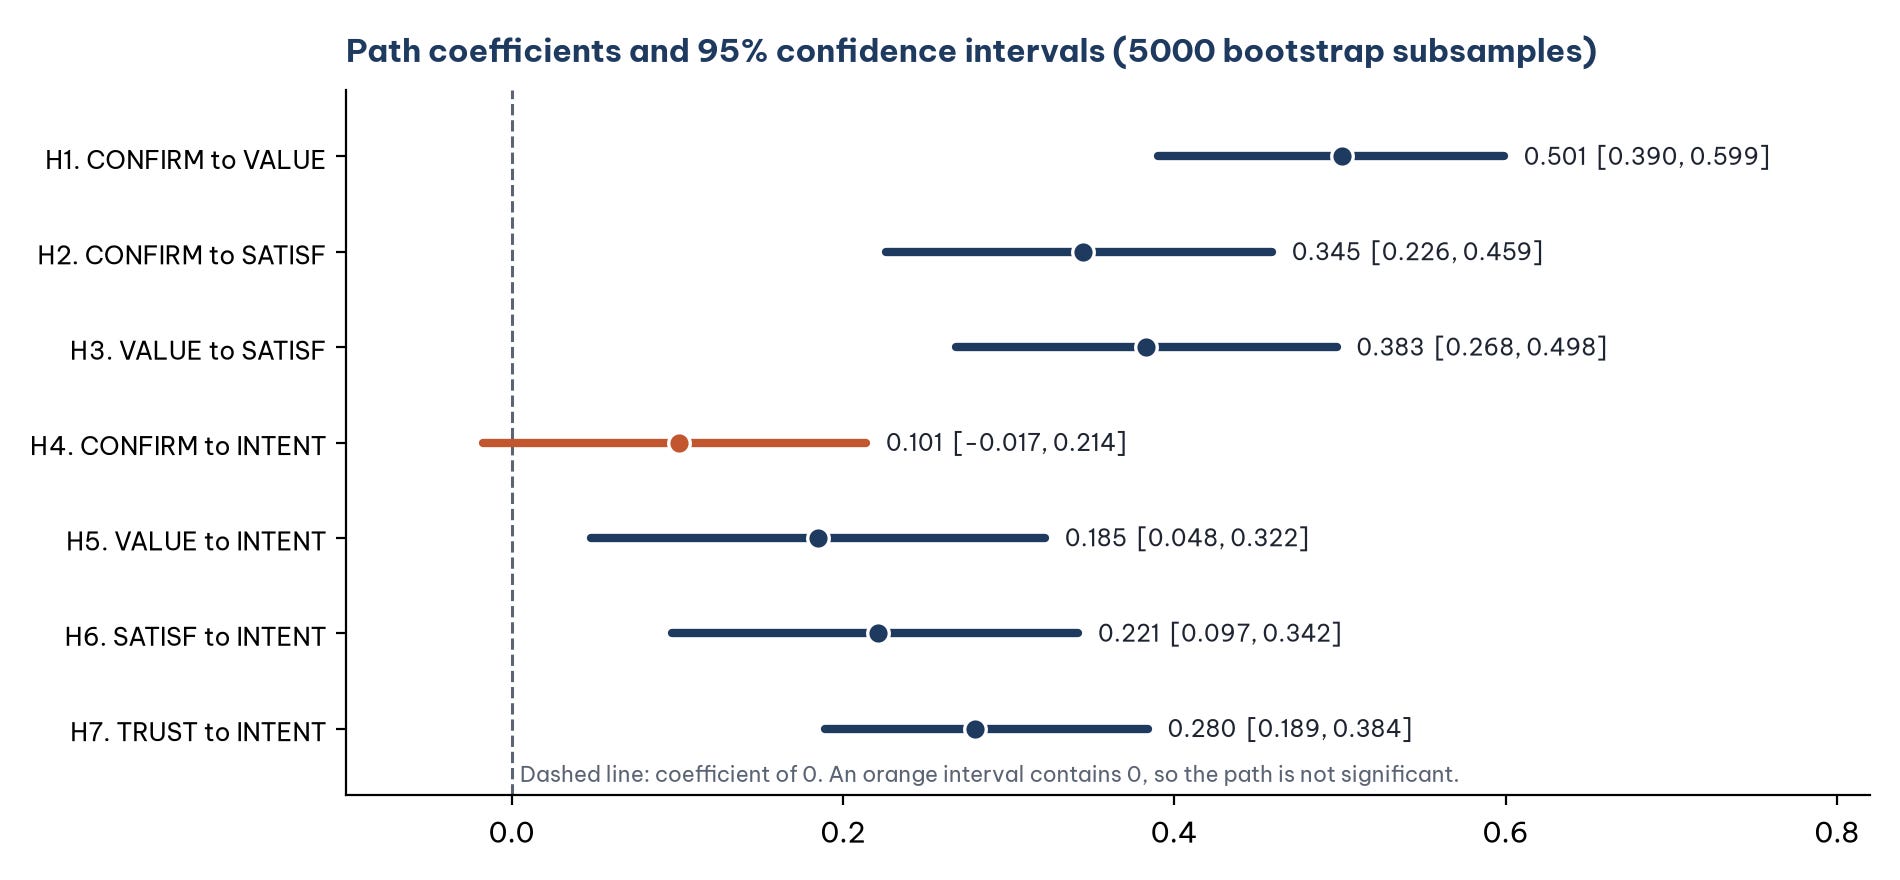
Reading the results:
Six hypotheses are supported. The confidence intervals of H1, H2, H3, H5, H6 and H7 lie entirely to the right of 0, and p is below 0.01.
H4 is not supported (t = 1.721, p = 0.085). The confidence interval [−0.017, 0.214] contains 0. This agrees with f² = 0.009 in Post 37 and with CB-SEM in Post 31 (p = 0.443).
H5 is significant but its confidence interval is wide [0.048, 0.322]: the effect of perceived value on intention is clearly positive, but it may be very small.
Statistical significance is not size. H5 has p = 0.008 but f² = 0.032 (small; Post 37). Report both.
4. One-tailed or two-tailed?
Hypotheses H1 to H7 are all directional (positive effects), so in theory a one-tailed test could be used. For H4, the one-tailed p value is half the two-tailed value, about 0.043, which is below 0.05.
This post still concludes that H4 is not supported, for two reasons:
The test must be chosen before looking at the results. Switching to a one-tailed test after seeing p = 0.085 to "rescue" a hypothesis is methodologically wrong.
The two-tailed test is the common default in PLS-SEM studies and is more conservative. If a thesis uses one-tailed tests, state this in the methods section, before the results, and apply it to every hypothesis.
Add a note in the text: with a one-tailed test, H4 is close to the 0.05 threshold. This is a borderline result that should be reported honestly, neither ignored nor exaggerated.
5. Checking with R
The script bootstrap.R runs the same model with the cSEM package: ordinary PLS-SEM, 5000 subsamples, percentile confidence intervals, 254 respondents. Because the random bootstrap subsamples differ from those of SmartPLS, the standard errors and p values agree only approximately:
The original coefficients (O) are identical, because they do not depend on the bootstrap subsamples. The conclusions for the seven hypotheses are the same in both programs. Two runs with different seeds in the same program also differ in the third decimal place in this way.
6. Reporting the results
The significance of the path coefficients was tested with bootstrapping (5000 subsamples, 95% percentile confidence intervals, two-tailed test). The results support six of the seven hypotheses. Expectation confirmation has a positive effect on perceived value (coefficient = 0.501; t = 9.603; p < 0.001; 95% CI [0.390, 0.599]) and on satisfaction (coefficient = 0.345; t = 5.782; p < 0.001). Perceived value has a positive effect on satisfaction (coefficient = 0.383; p < 0.001) and on repurchase intention (coefficient = 0.185; t = 2.662; p = 0.008). Satisfaction (coefficient = 0.221; p < 0.001) and trust (coefficient = 0.280; t = 5.598; p < 0.001) have positive effects on repurchase intention. The direct effect of expectation confirmation on repurchase intention is not statistically significant (coefficient = 0.101; t = 1.721; p = 0.085; 95% CI [−0.017, 0.214]), so H4 is not supported.
The hypothesis table in a thesis should include: the coefficient (O), t, p, the 95% confidence interval, f² (Post 37) and the conclusion. In a note below the table, give the number of bootstrap subsamples, the type of confidence interval and whether the test is one-tailed or two-tailed.
Five common mistakes
Reporting the Sample mean (M) instead of the Original sample (O). The coefficient to report is O.
Writing p = 0.000. A p value is never 0; write p < 0.001.
Switching to a one-tailed test after seeing the results to make a hypothesis significant (section 4).
Using too few bootstrap subsamples, for example 500. The p values and confidence intervals will vary a lot between runs.
Not reporting the settings. Without the number of subsamples, the type of confidence interval and the number of tails, readers cannot check the results.
Frequently asked questions
Why does the p value change slightly when I run it again?
With Random seed, every run draws different bootstrap subsamples. Choose Fixed seed to get the same results. With 5000 subsamples, runs differ only in the third decimal place.
Is t larger than 1.96 significant?
Yes, for a two-tailed test at the 5% level. For a one-tailed test the threshold is 1.645. At the 1% level (two-tailed) it is 2.576.
If H4 is not significant, does CONFIRM have no influence on INTENT?
You can only conclude that the direct effect is not significant. Confirmation can still affect intention indirectly through perceived value and satisfaction. Post 40 tests this indirect effect with the tables Specific indirect effects and Total effects of the same bootstrapping report.
Do I need to bootstrap the loadings and weights?
For formative measurement, bootstrap the outer weights, as in Post 36. For reflective measurement, the loadings are usually large and therefore significant; the Outer loadings table of the same report gives the p values if your supervisor asks for them.
References
Aguirre-Urreta, M. I., & Rönkkö, M. (2018). Statistical inference with PLSc using bootstrap confidence intervals. MIS Quarterly, 42(3), 1001–1020. https://doi.org/10.25300/MISQ/2018/13587
Hair, J. F., Hult, G. T. M., Ringle, C. M., & Sarstedt, M. (2022). A primer on partial least squares structural equation modeling (PLS-SEM) (3rd ed.). SAGE Publications.
Hair, J. F., Risher, J. J., Sarstedt, M., & Ringle, C. M. (2019). When to use and how to report the results of PLS-SEM. European Business Review, 31(1), 2–24. https://doi.org/10.1108/EBR-11-2018-0203
Ringle, C. M., Wende, S., & Becker, J.-M. (2026). SmartPLS 4 (Version 4.1.2.1) [Computer software]. SmartPLS GmbH. https://www.smartpls.com
Streukens, S., & Leroi-Werelds, S. (2016). Bootstrapping and PLS-SEM: A step-by-step guide to get more out of your bootstrap results. European Management Journal, 34(6), 618–632. https://doi.org/10.1016/j.emj.2016.06.003
Discussion about this post