What Is PSPP? Installing the Free SPSS Alternative and Its Interface
The free SPSS alternative compared with SPSS, installed on Windows, macOS or Linux, with a tour of its four windows and a first analysis


Key takeaways
PSPP is a free GNU program whose menus, dialogs and syntax follow SPSS, and it reads and writes SPSS .sav files.
It has every procedure used in the SPSS part of this series, but it cannot open .xlsx files directly and does not estimate SEM.
Windows users install it with an installer linked from the GNU download page, Mac users from the signed application bundle and Linux users from their package repository.
Data View holds the data and Variable View the variable definitions; check the status bar for an active filter before every analysis.
Syntax makes the analysis reproducible: every command ends with a period, and the Paste button turns a dialog into a command.
The first obstacle to learning SPSS is often not statistics but the software license. IBM SPSS Statistics (IBM Corp., 2026) is commercial software; the trial version lasts only a short time, and a long-term license is a considerable expense for a student. For this reason, the SPSS posts in this series are worked through in PSPP, a free program whose interface and syntax are almost identical to those of SPSS.
This post introduces PSPP, compares it with SPSS and explains how to install it. It then walks through the four main working windows and runs a first analysis on the sample dataset of the series. All figures are real screenshots of PSPP.
Sample data. The data file
marketplace_x_raw.savused in this post is in the research-data-analysis repository on GitHub (folderdata/); the.csvand.xlsxversions are in the00-shared-datafolder. Download the whole repository with Code > Download ZIP.
About the screenshots. All figures are real screenshots of PSPP 2.1.2 on macOS (Apple silicon Mac), taken on 19 November 2026 with the English data file
marketplace_x_raw.sav. On the Mac, each PSPP window has its own menu bar inside the window rather than in the macOS menu bar at the top of the screen. Information on versions and downloads comes from the GNU PSPP website, the GNU release announcements and the macOS builds page linked from the GNU download page, accessed on 19 November 2026.
1. What is PSPP?
PSPP is a statistical analysis program from the GNU Project, released under the GPL free software license. It is designed as a free replacement for SPSS: its menus, dialogs, data layout and syntax language all follow SPSS. PSPP reads and writes SPSS .sav data files, so you can open files that other people send you, or send files back to SPSS users, without any conversion.
The latest stable release is PSPP 2.1.3, released on 23 October 2026; compared with 2.1.2, it brings bug fixes and two new functions for the MATRIX command (Pfaff, 2026b). The screenshots in this post were taken with PSPP 2.1.2 (Free Software Foundation, 2026), released on 19 September 2026 with translation updates and bug fixes (Pfaff, 2026a), because 2.1.2 is the version of the current macOS application bundle (Beckmann, n.d.). The 2.1.3 announcement lists only bug fixes and the new MATRIX functions, so the menus and dialogs used in this post should look the same in 2.1.3.
2. PSPP and SPSS: similarities and differences
For the techniques covered in the SPSS part of this series, PSPP has every procedure you need. When preparing the series, I ran the following procedures on the sample dataset in PSPP 2.0 and confirmed that they work: descriptive statistics and frequency tables, Cronbach's alpha with item-total statistics, exploratory factor analysis with the KMO measure and Promax rotation, correlation, linear regression with Tolerance and VIF, t-tests, one-way ANOVA with Levene's test and the Tukey post hoc test, plus nonparametric tests.
Three differences to keep in mind from the start:
PSPP does not open Excel .xlsx files directly. Save the Excel file as CSV, or in LibreOffice's ODS format, before importing it. Post 7, "Importing Survey Data from Excel and Google Forms into PSPP (SPSS)" shows how.
Some extensions written specifically for SPSS, such as Hayes's PROCESS macro, are not guaranteed to run in PSPP.
PSPP does not estimate structural equation models (SEM). SPSS does not do this either: SEM is carried out with AMOS or SmartPLS in later parts of the series.
One benefit that is rarely mentioned: because PSPP uses the same menus and syntax as SPSS, what you learn in PSPP transfers to SPSS almost unchanged. If your university or employer later gives you an SPSS license, you can start using it right away.
3. Installing PSPP
The GNU Project publishes the PSPP source code but does not release official binaries; its download page links to the places where third parties offer ready-to-install versions (Pfaff, 2026b; GNU Project, n.d.):
Windows: download an installer from the latest-release directory linked on the GNU PSPP download page. Use the smaller, non-debug installer (the file name without the word debug; on 19 November 2026 it was
pspp-64bit-install-2-1-3-release.exe). Run the installer and accept the default steps.macOS: the GNU download page recommends the application bundle as the easiest path for new users. It links to the PSPP MacOS bundles page, maintained by Friedrich Beckmann (
https://www.tha.de/~beckmanf/pspp/). On 19 November 2026, the stable bundle was PSPP 2.1.2, with one.dmgfile for Apple silicon (ARM) Macs running macOS 14 or later and one for Intel Macs running macOS 15 or later; the files are signed and notarized (Beckmann, n.d.). Download the file that matches your chip, open the.dmgand install the application the usual Mac way. The screenshots in this post come from the Apple silicon (arm64) bundle. If you are used to the command line, you can install PSPP through MacPorts (port install pspp, orport install pspp-develfor the latest version) or through the PSPP Homebrew tap (GNU Project, n.d.). The bundle contains only the graphical program; it does not let you runpsppfrom the Terminal (Beckmann, n.d.).Linux: install PSPP from your distribution's package repository, for example
sudo apt install psppon Debian and Ubuntu ordnf install psppon Fedora. A Flatpak is also available on Flathub (flatpak install flathub org.gnu.pspp) (GNU Project, n.d.).
Download PSPP only from the GNU website, the sites it links to or your operating system's package repository, and avoid third-party download sites. After installing, open the application PSPPIRE, the name of PSPP's graphical interface (the window titles read PSPPIRE Data Editor, PSPPIRE Output Viewer and so on).
4. Opening the sample dataset
The whole series uses one simulated dataset for the study "Factors affecting customers' repurchase intention on online marketplace X" (see Post 2, "The 7-Step Quantitative Research Process"). The dataset has 300 questionnaires, 20 observed items measuring 5 constructs, screening questions, an attention check and demographic information. Some errors are planted on purpose so that you can practice data cleaning in later posts.
The English dataset marketplace_x_raw comes in three formats: marketplace_x_raw.sav (opens directly in PSPP and SPSS), .csv and .xlsx. To open the .sav file, choose File > Open, browse to the file and click Open. In the screenshots, the file is stored in the folder Documents/MarketplaceX.
5. The four main working windows
Like SPSS, PSPP organizes the work in separate windows: the Data Editor for viewing and defining data, with two tabs, Data View and Variable View; the Output Viewer for results; and the Syntax Editor for writing commands.
Data View: where the data live
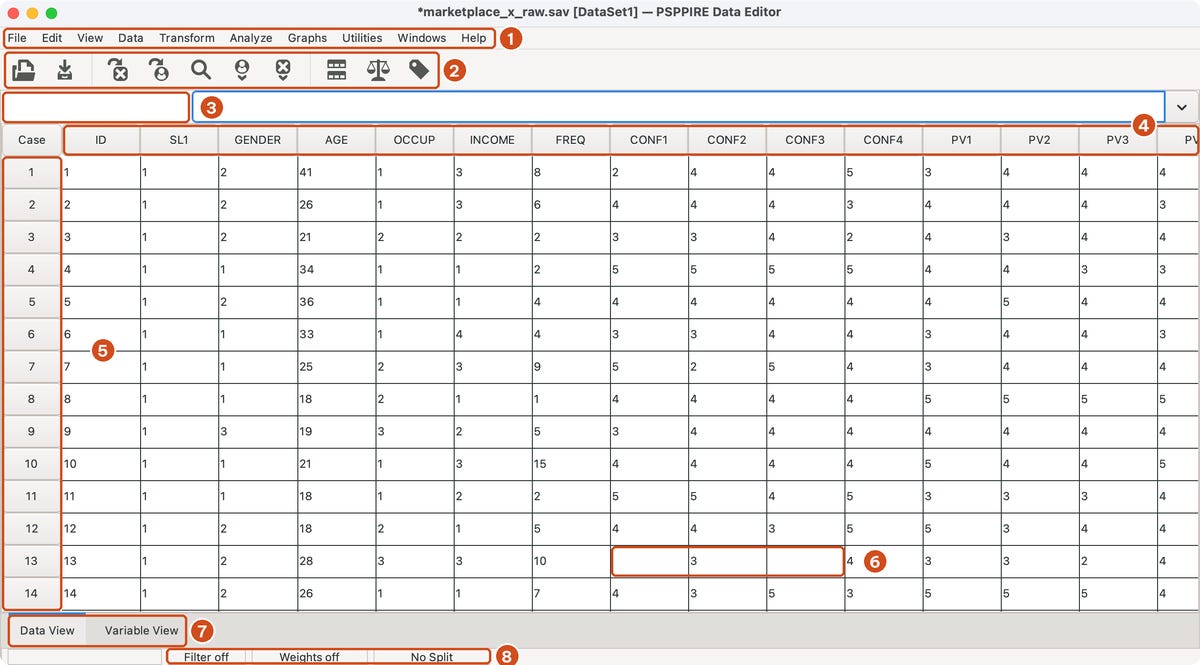
Menu bar: holds every function. The two menus you will use most are Transform (transforming data) and Analyze (analysis). On the Mac, the menu bar is part of the PSPP window, not the macOS menu bar at the top of the screen.
Toolbar: shortcut buttons for common tasks such as opening a file, saving a file and searching. The label-shaped button at the end switches the display of value labels on or off, for example showing "Female" instead of the number 2.
Cell reference box and cell contents box: show which case and which variable the selected cell belongs to, and the value in that cell.
Column headings: each column is one variable, that is, one question in the questionnaire.
Case number column (Case): each row is one case, that is, one questionnaire.
Empty cells: case 13 left questions CONF1 and CONF3 unanswered. PSPP treats an empty cell as a missing value (system-missing). Handling missing values is covered in Post 8, "Data Cleaning in PSPP (SPSS)".
Tabs for switching between Data View and Variable View.
Status bar: tells you whether the data are filtered (Filter), weighted (Weights) or split into groups (Split). Check this bar before every analysis: a filter you forgot to switch off is a common reason why the number of cases in the output does not match the data.
Variable View: where variables are defined
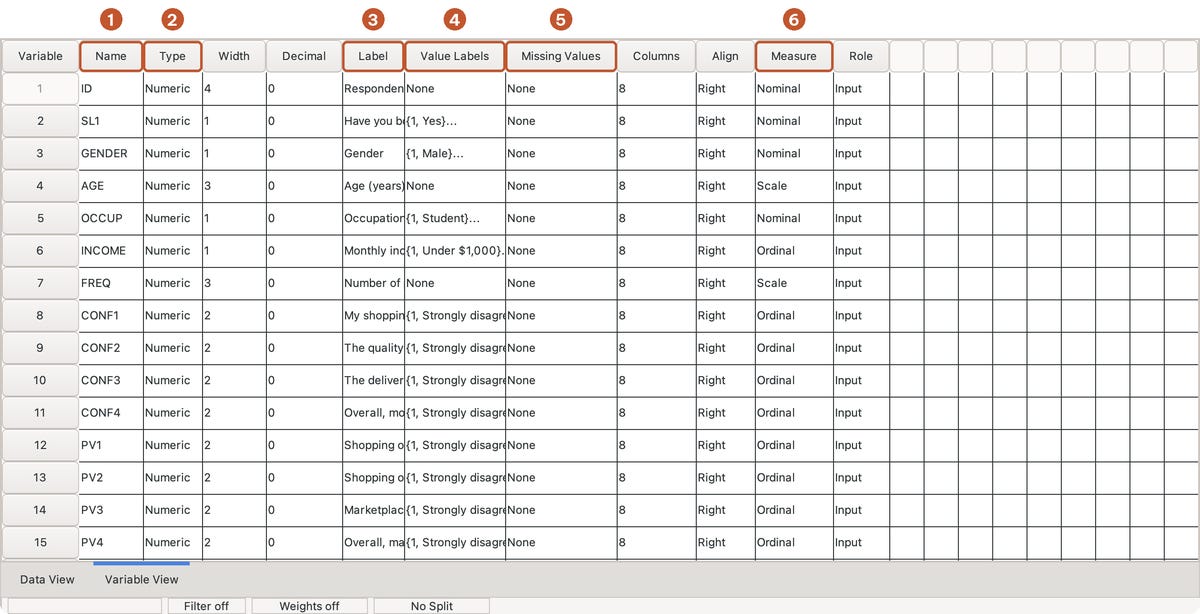
In Variable View, each row describes one variable. The six most important properties are:
Name: a short variable name without spaces, for example
SAT1.Type: the data type, usually Numeric.
Label: the variable label, that is, the full text of the question, for example "Gender" or "Age (years)".
Value Labels: labels for the codes, for example 1 = "Male", 2 = "Female".
Missing Values: user-defined missing value codes, for example 99 = "no answer".
Measure: the level of measurement, Nominal, Ordinal or Scale, as explained in Post 3, "Levels of Measurement and Likert Scales".
How to set each property is shown step by step in the next post, Post 6, "Defining and Coding Variables in PSPP (SPSS)".
6. Running a first analysis with the menus
Let us build a frequency table for the gender variable to get used to the routine of choosing a menu, selecting variables and reading the output.
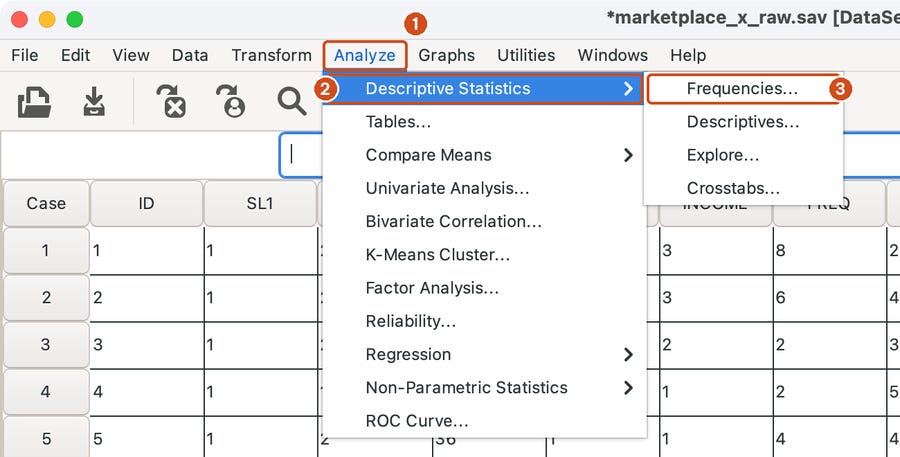
Step 1. Choose Analyze > Descriptive Statistics > Frequencies.
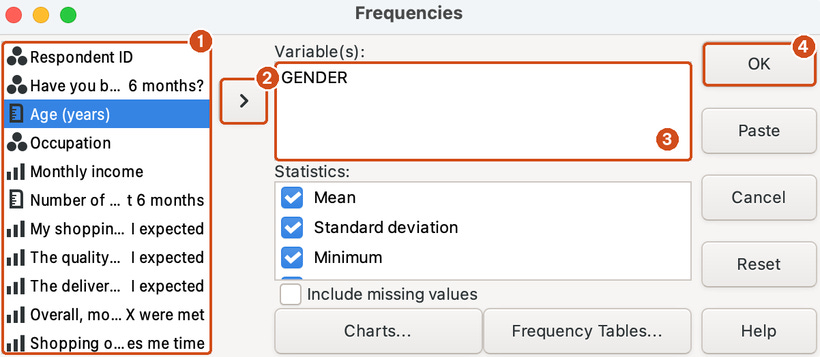
Step 2. In the Frequencies dialog, select the variable Gender in the list on the left, click the arrow button to move it to the Variable(s) box, then click OK.
Step 3. The results appear in the Output Viewer window.
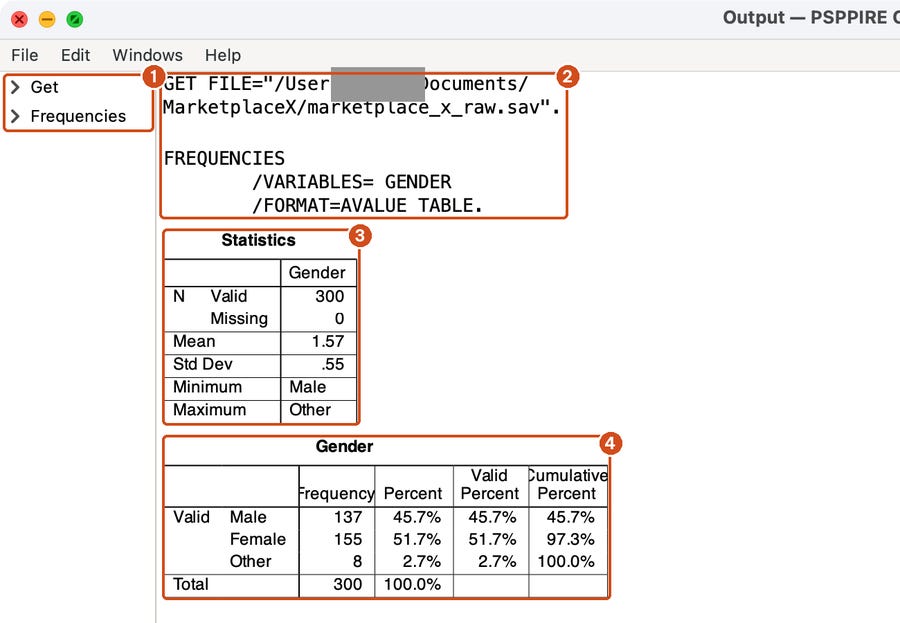
The sample has 137 men (45.7%), 155 women (51.7%) and 8 people who chose "Other" (2.7%). Look at the Statistics table above it: PSPP reports a mean of 1.57 for gender. The program does not stop you from computing this, but the number is meaningless, because gender is a nominal variable and the codes 1, 2 and 3 only serve to classify. This is exactly the "mean of a nominal variable" mistake described in Post 3. For a nominal variable, report only frequencies and percentages.
You will also see that the Valid Percent column equals the Percent column, because the gender variable has no missing values. When there are missing values, Valid Percent is calculated on the number of respondents who answered, and that is the column to report.
7. Getting to know syntax
Every action you take with the menus actually produces a syntax command, as you can see at the top of the output. Writing commands directly in the Syntax window has three advantages:
Reproducible: you can rerun the whole analysis with a single click, which is very useful when the data change or your thesis committee asks you to check the results again.
Recorded: a
.spssyntax file is a complete record of what you did with the data.Shared with SPSS: the syntax of common commands runs in both programs.
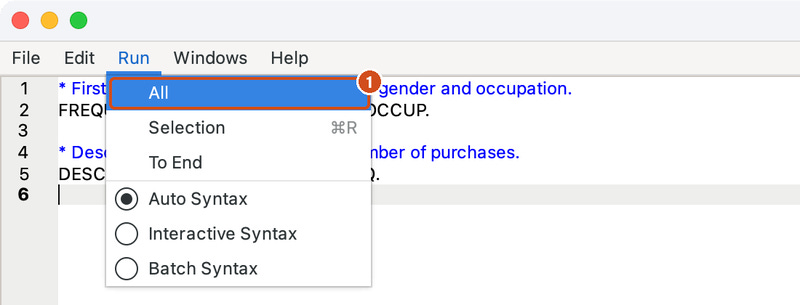
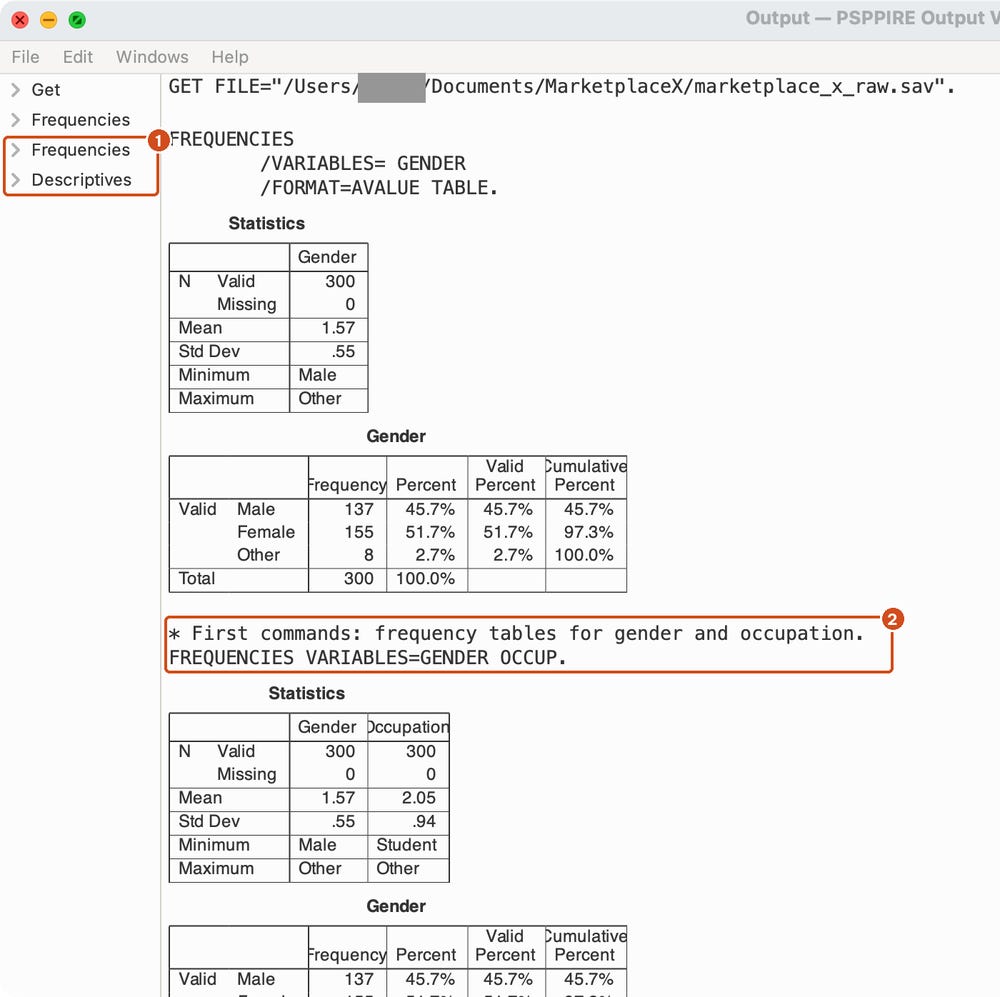
To open a Syntax window, choose File > New > Syntax, type the commands, then choose Run > All to run everything.
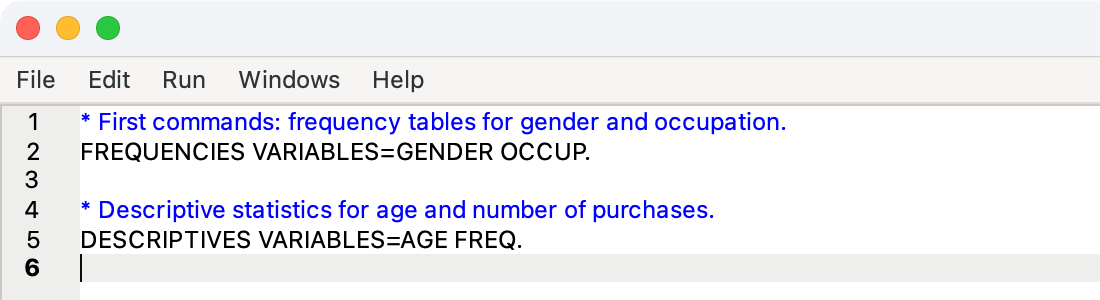
* First commands: frequency tables for gender and occupation.
FREQUENCIES VARIABLES=GENDER OCCUP.

* Descriptive statistics for age and number of purchases.
DESCRIPTIVES VARIABLES=AGE FREQ.
Two syntax rules to remember: every command ends with a period, and a comment line, which starts with an asterisk, must also end with a period. A missing period is the most common syntax error among beginners.
A useful tip: most analysis dialogs have a Paste button. Instead of clicking OK, click Paste to copy the corresponding command into the Syntax window. This is the quickest way to learn syntax without memorizing commands.
Four common beginner mistakes
Running an analysis while a filter is still on. Always check the status bar before analyzing.
Computing and reporting the mean of a nominal variable. Check the Measure column in Variable View before choosing statistics.
Leaving out the period at the end of a syntax command. PSPP reports an error or merges the next command into the previous one.
Opening an Excel .xlsx file directly. PSPP cannot read this format; save the file as CSV or ODS first.
Frequently asked questions
Is PSPP acceptable for a thesis?
PSPP carries out the standard statistical procedures, and the choice of program does not change the nature of the analysis technique. What matters is that you state the name and version of the software in the methods section and cite the software in the reference list. If your university has specific software requirements, follow them.
Does PSPP give the same results as SPSS?
For common procedures, the two programs use the same statistical formulas, so the results are essentially the same. Some differences can come from default settings or from the way tables are laid out. When you report results, name the software you actually used.
I already know SPSS. Is it hard to switch to PSPP?
No. The menus, dialogs and syntax are nearly the same. The biggest difference you will notice is that PSPP has fewer options in some dialogs and simpler charts.
References
Beckmann, F. (n.d.). PSPP MacOS bundles. Retrieved November 19, 2026, from https://www.tha.de/~beckmanf/pspp/
Free Software Foundation. (2026). GNU PSPP (Version 2.1.2) [Computer software]. https://www.gnu.org/software/pspp/
GNU Project. (n.d.). Obtaining GNU PSPP. Retrieved November 19, 2026, from https://www.gnu.org/software/pspp/get.html
IBM Corp. (2026). IBM SPSS Statistics (Version 32.0) [Computer software]. IBM Corp.
Pfaff, B. (2026a, September 19). pspp-2.1.2 released [stable] [Mailing list post]. Info-GNU. https://lists.gnu.org/archive/html/info-gnu/2026-09/msg00005.html
Pfaff, B. (2026b, October 23). pspp-2.1.3 released [stable] [Mailing list post]. Info-GNU. https://lists.gnu.org/archive/html/info-gnu/2026-10/msg00003.html
Discussion about this post