Levels of Measurement and Likert Scales in SPSS and PSPP
Nominal, ordinal, interval and ratio scales, declaring them in SPSS and PSPP, 5-point or 7-point Likert items and choosing a technique by variable type


Key takeaways
The four levels of measurement, nominal, ordinal, interval and ratio, each add one property: classification, order, equal intervals and a true zero.
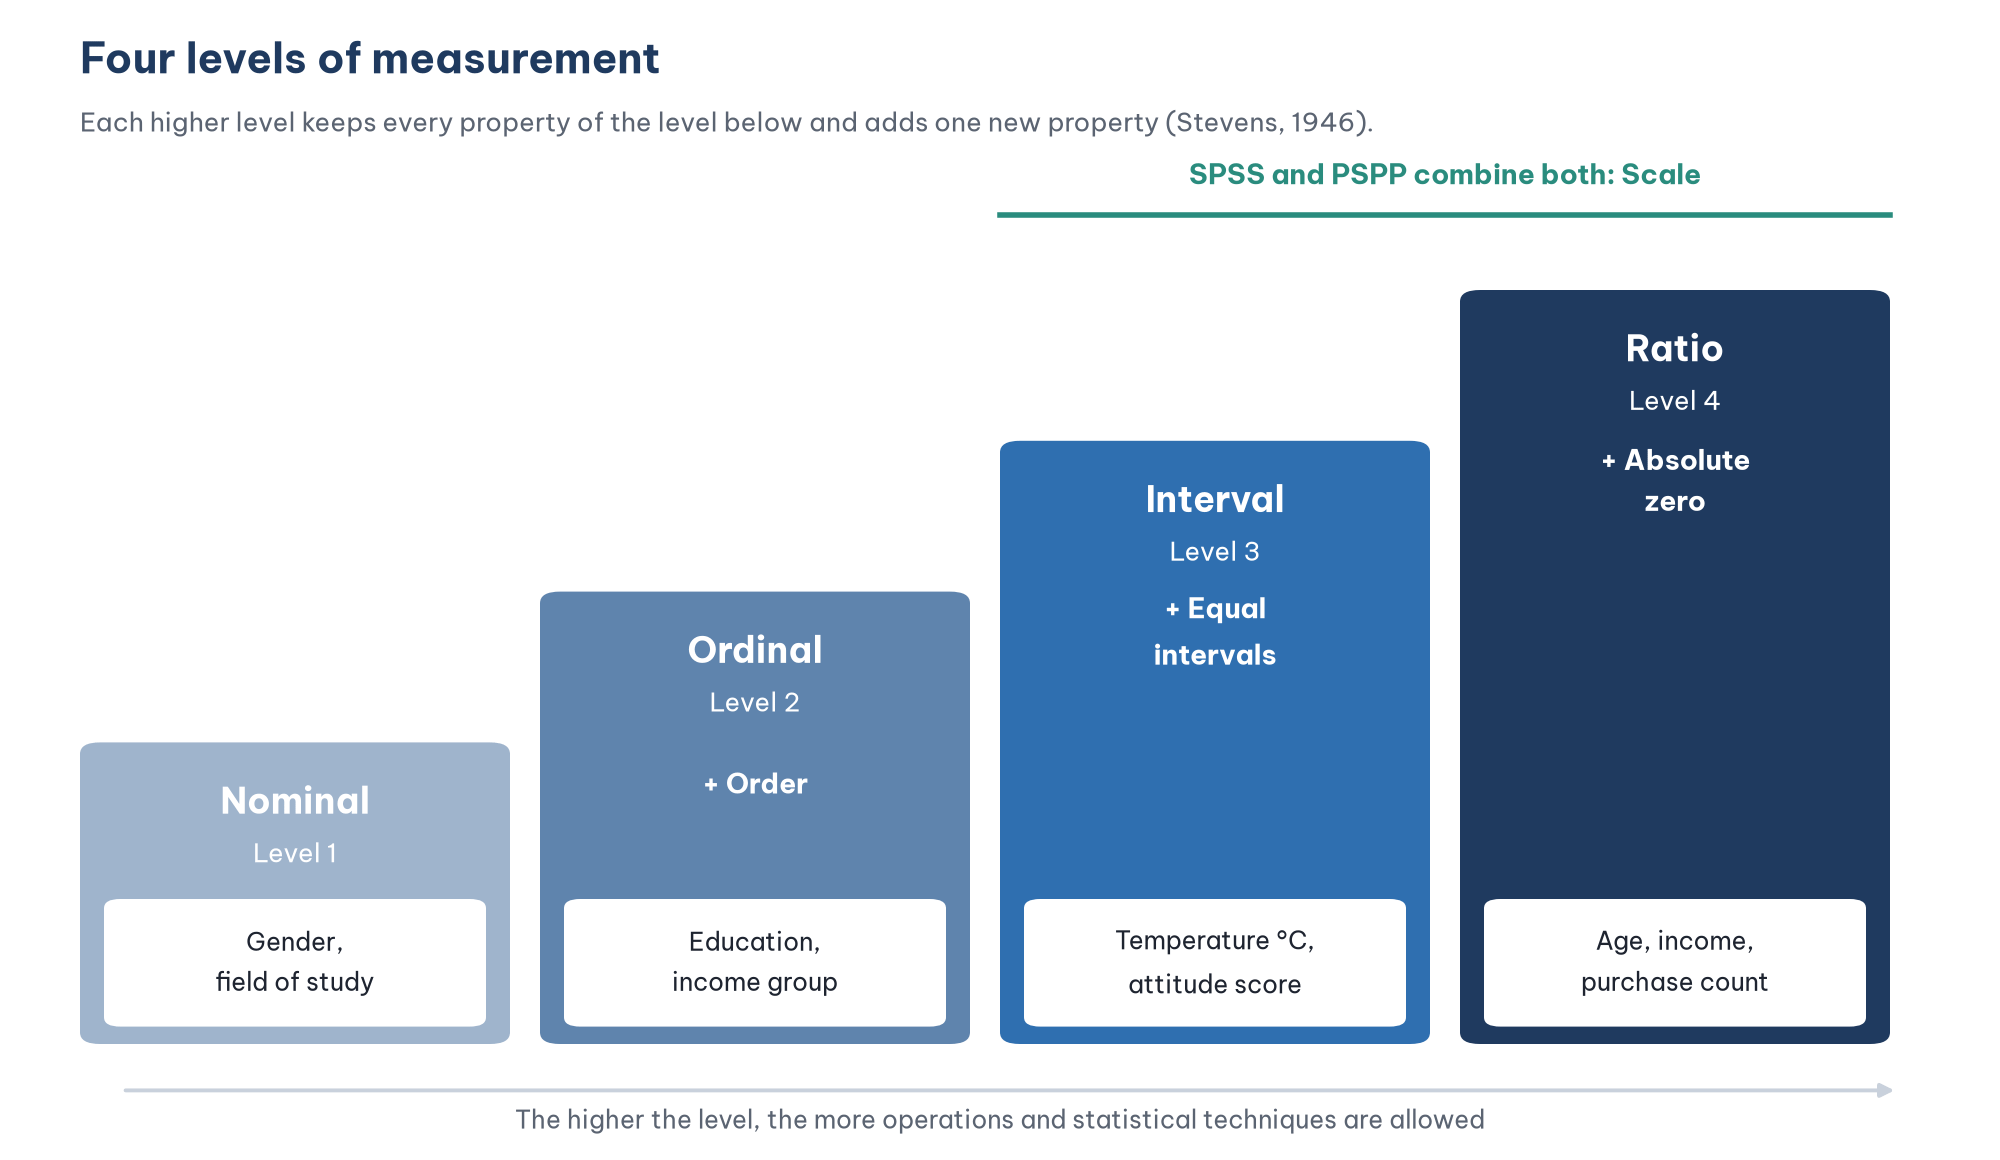
SPSS and PSPP combine the interval and ratio levels into one Measure type, Scale.
A single Likert item is ordinal; the mean score of a multi-item Likert scale is commonly analyzed as an interval variable.
Keep the number of points of an adopted scale, and reverse-code reverse-worded items before computing Cronbach's alpha or a mean score.
Collect data at the highest level you can: age in years can become age groups, but not the other way round.
When you define a variable in SPSS or PSPP, you have to set its Measure column to Nominal, Ordinal or Scale. When you choose a statistical test, you need to know what kind of variable you have to decide between a t-test, a chi-square test or a regression. Both decisions rest on the same piece of background knowledge: the level of measurement of each variable.
This post explains the four basic levels of measurement, how to declare them in SPSS and PSPP, what you need to know about Likert scales and how the level of measurement determines the analysis technique. It belongs to the foundations group of the series and follows Post 2, "The 7-Step Quantitative Research Process".
"Scale" has two meanings
The word "scale" is used for two different ideas, and beginners often mix them up:
Level of measurement: whether a variable is measured on a nominal, ordinal, interval or ratio scale. This is the main topic of this post.
Multi-item scale of a construct: a set of questions that together measure one latent construct, for example the "Satisfaction" scale with four items in the running example of this series, repurchase intention on an online marketplace (Marketplace X). When people talk about "testing the reliability of a scale" with Cronbach's alpha, they use the word in this sense.
In this post, "scale" has the first meaning unless stated otherwise.
1. The four levels of measurement
The most widely used classification was proposed by Stevens (1946). It has four levels ordered from lowest to highest. Each higher level keeps every property of the levels below it and adds one new property.
Nominal scale
The numbers only classify; they have no order. Examples: gender (1 = Male, 2 = Female), field of study, region of residence. Code 2 is not "larger" than code 1, and swapping the codes does not change the information. For a nominal variable, you can only count frequencies, compute percentages and find the mode.
Ordinal scale
The values have an order, but the distances between categories are not necessarily equal. Examples: level of education (secondary school, bachelor's degree, postgraduate degree), a ranking of priorities, income groups. You know that "postgraduate" is higher than "bachelor's", but you cannot say that the distance between these two categories equals the distance between "secondary school" and "bachelor's". Suitable statistics are the median, percentiles and nonparametric tests.
Interval scale
The distances between values are equal and meaningful, but zero is an arbitrary point, not "nothing". The classic example is temperature in °C: going from 20 °C to 30 °C is the same increase as going from 30 °C to 40 °C, but 0 °C does not mean there is no heat, and 40 °C is not "twice as hot" as 20 °C. For an interval variable, you can compute the mean and the standard deviation and use parametric tests.
Ratio scale
A ratio scale has every property of an interval scale plus an absolute zero, so division is meaningful. Examples: age, income, number of purchases per month, hours spent on social media per day. A person who earns 2,000 a month earns twice as much as a person who earns 1,000.
2. Declaring the level of measurement in SPSS and PSPP
SPSS combines the interval and ratio levels into one type, Scale, because the statistical techniques for the two are almost the same (Field, 2024). PSPP, the free alternative used in this series (Post 5, "What Is PSPP?"), has the same three options. In the Measure column of Variable View, choose:
Nominal: nominal variables (gender, field of study).
Ordinal: ordinal variables (education, age group).
Scale: interval and ratio variables (age in years, income, the mean score of a Likert scale).
Declaring the level correctly lets the program suggest suitable charts and procedures, and avoids errors in procedures that check the level of measurement. Post 6, "Defining and Coding Variables in PSPP (SPSS)" shows the steps in detail.
3. Likert scales
The Likert format is the most common type of question in theses in business and management. Respondents state how much they agree with a statement, for example from 1 = Strongly disagree to 5 = Strongly agree.
A Likert-type item is not a Likert scale
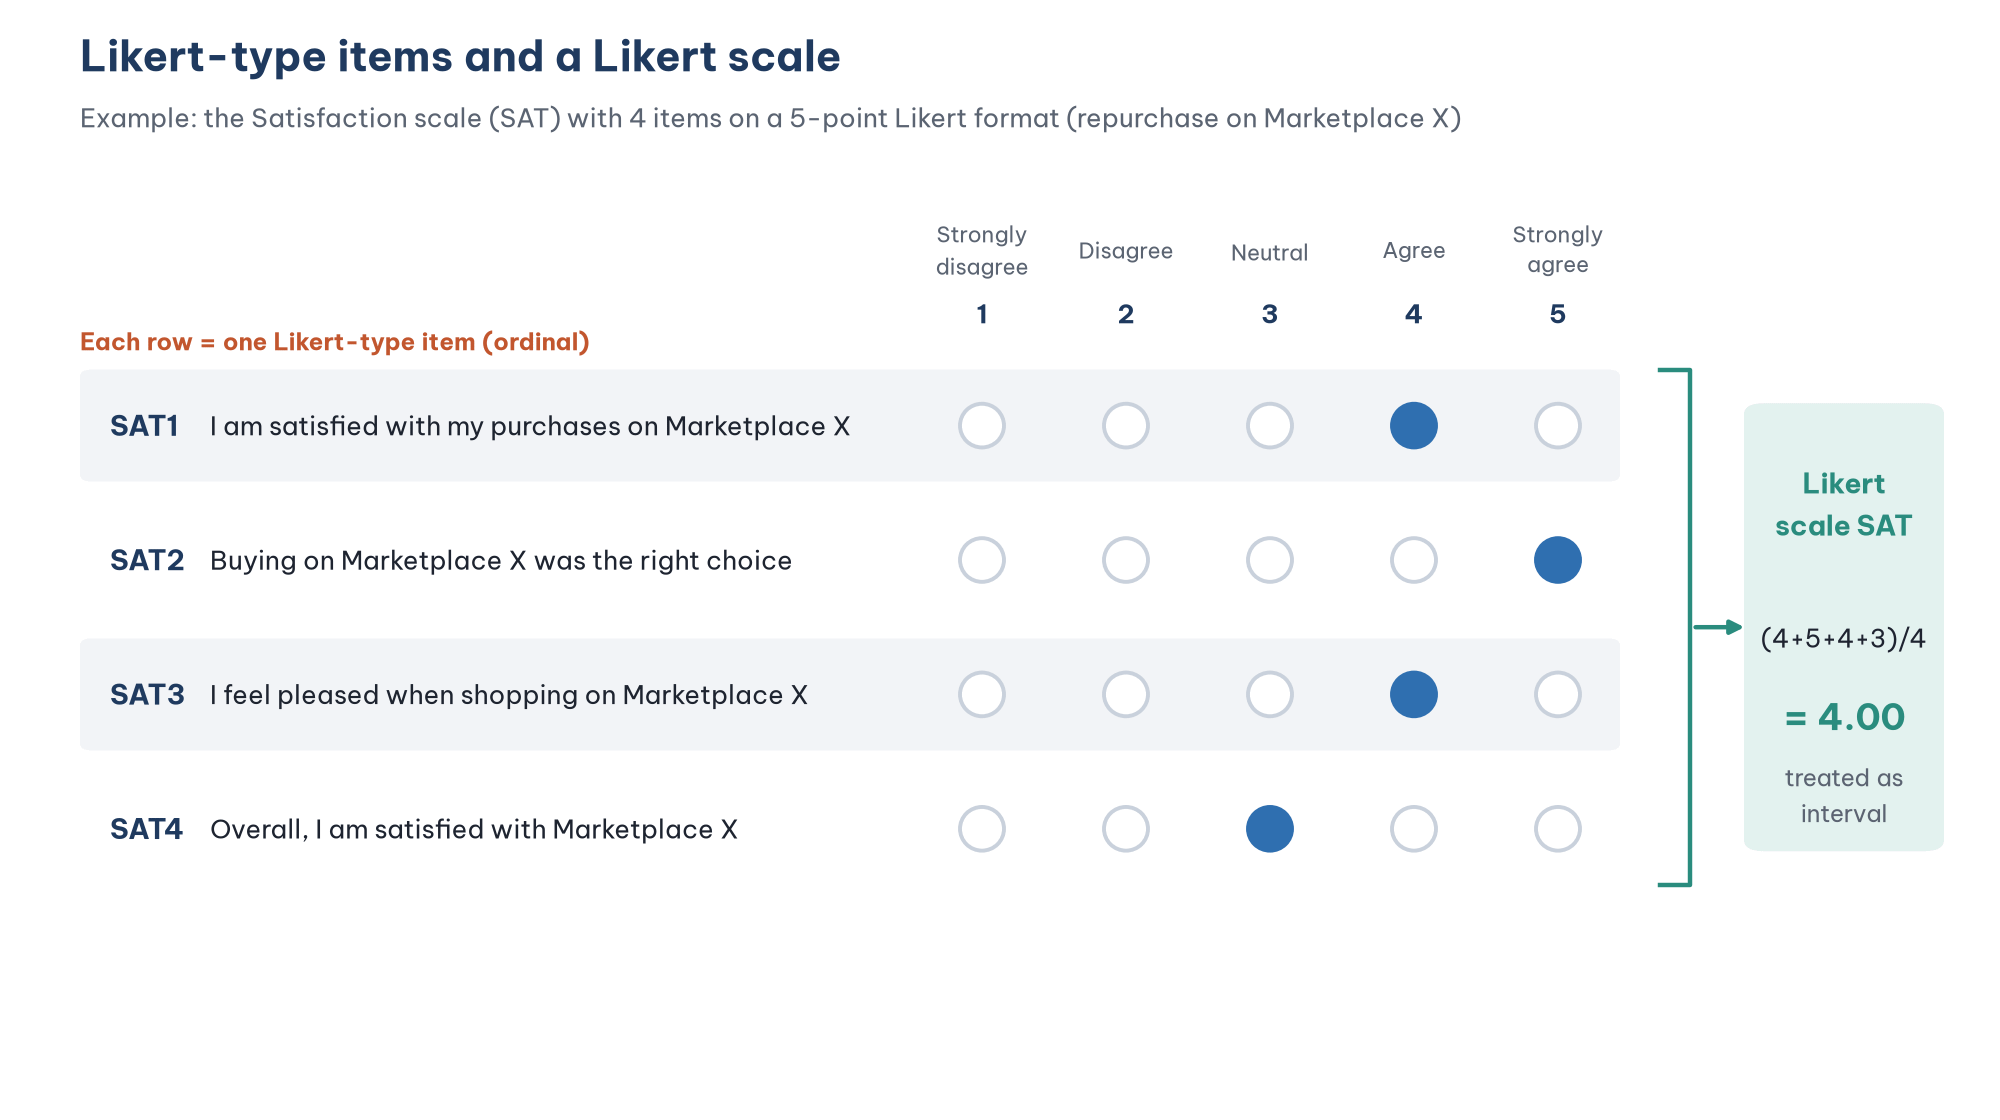
In his original work, Likert (1932) built attitude scales by adding up the scores of several statements that measure the same attitude. You therefore need to distinguish:
Likert-type item: a single question with ordered response options.
Likert scale: the sum or mean of several items that measure the same construct.
This distinction matters when you choose the analysis technique (Carifio & Perla, 2007).
Is Likert data ordinal or interval?
This is a long-running debate. Strictly speaking, a single Likert item is an ordinal variable: nothing guarantees that the distance between "agree" and "strongly agree" equals the distance between "neutral" and "agree". Some authors therefore argue that you should not compute means or use parametric tests on Likert data (Jamieson, 2004).
The opposing view holds that a composite score from several items can be treated as an interval variable, and that parametric tests such as the t-test, ANOVA and Pearson correlation remain robust with this kind of data, even when the distribution is not normal (Carifio & Perla, 2007; Norman, 2010). Common practice in business and management research follows this view: analyze the mean score of a multi-item scale as an interval variable, and be more careful when you analyze single items on their own.
Practical tip: in SPSS or PSPP, you can leave single Likert items as Ordinal and set the mean-score variable created with Compute to Scale.
5 points or 7 points?
There is no single answer. The experiment of Preston and Colman (2000) showed that scales with too few response categories (2 to 4) had poorer reliability and validity, while scales with about 7 to 10 categories were rated well by respondents and gave high reliability indices. In practice:
Keep the number of points of the original scale when you adopt an existing scale, so that your results can be compared with earlier studies.
Use 5 points when respondents have diverse backgrounds or the questionnaire is long, because a 5-point format is easy to understand and quick to answer.
Use 7 points when you need finer distinctions and respondents are used to surveys.
Be consistent in the number of points and the direction of the scale across the whole questionnaire.
Reverse-worded items
A reverse-worded item is a statement whose meaning runs opposite to the construct being measured, for example "I feel disappointed after my purchases on Marketplace X" in a satisfaction scale. Such items help to detect respondents who answer on autopilot, but they can also confuse respondents and lower reliability, and they can even make EFA extract a separate factor that contains only the reverse-worded items (Weijters et al., 2013).
If you use reverse-worded items, write them clearly, avoid double negatives and reverse-code them (for example 1 becomes 5, 2 becomes 4) before you compute Cronbach's alpha or a mean score. In the Marketplace X data set, the Trust item TRU4, "I worry that Marketplace X does not keep its promises", is reverse-worded, and its reverse-coded version is TRU4R. Post 10, "Recoding Variables and Computing Composite Scores in PSPP (SPSS)" shows how to do this.
4. Other scale formats
Semantic differential scale: two opposite adjectives sit at the two ends, for example "Cheap ... Expensive", and respondents choose a position between them (Osgood et al., 1957). It suits the measurement of brand image or perceptions of a product.
Numerical rating scale: for example a score from 0 to 10. Questions about how likely someone is to recommend a product to others often use this format.
Ranking scale: respondents put options in order of preference. The result is ordinal data, and the values depend on each other, so you should not analyze them as independent Likert items.
5. The level of measurement determines the analysis technique
When you choose a test, first identify the level of measurement of the dependent variable and of the independent variable (Field, 2024; Hair et al., 2019). Figure 3 summarizes the common cases in a thesis.
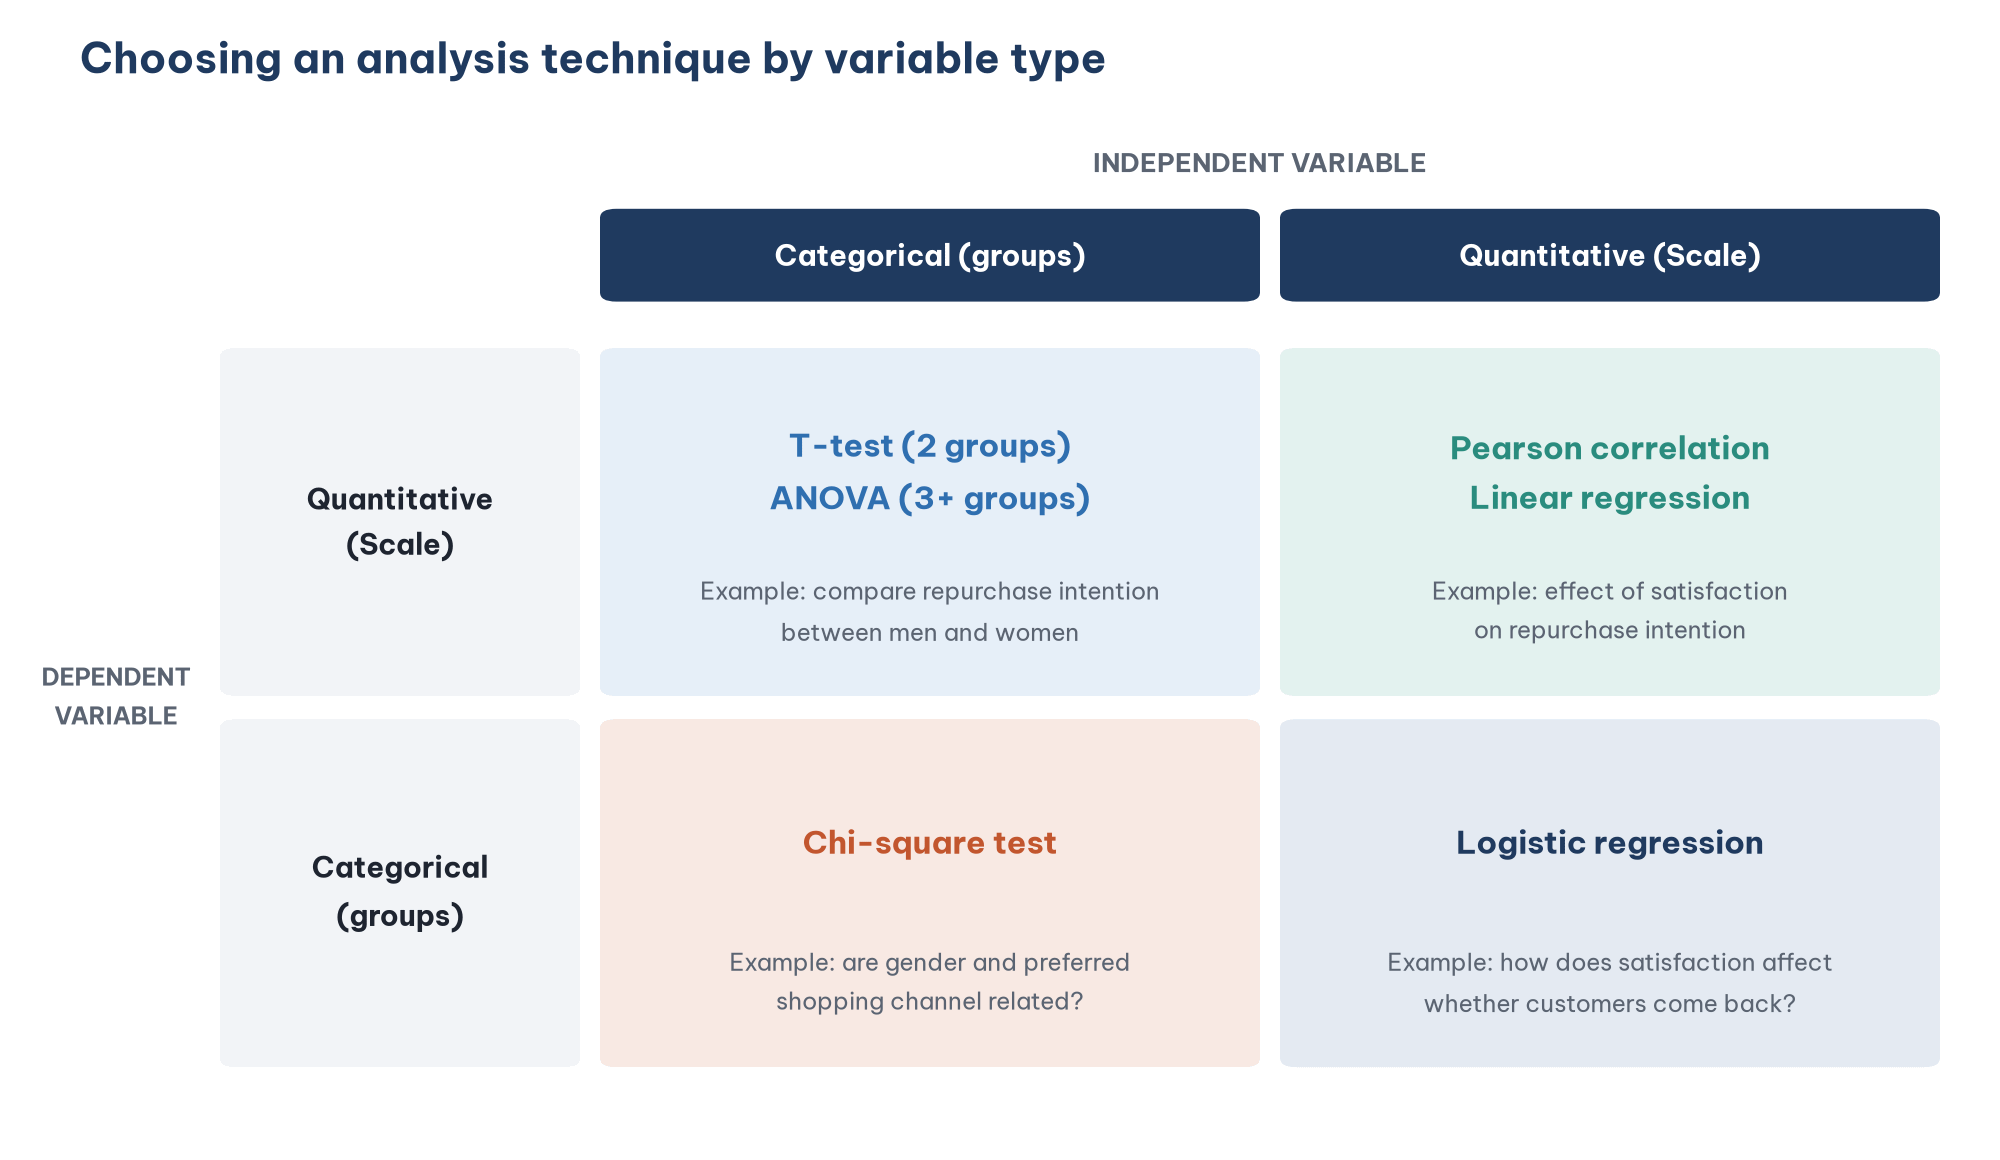
An important design rule: collect data at the highest level of measurement you can. You can always turn age in years (ratio) into age groups (ordinal), but you cannot go the other way. Asking "How old are you?" gives more analysis options than asking "Which age group are you in?", unless an exact figure makes respondents reluctant to answer, as with income.
Four common mistakes
Computing a mean for a nominal variable. A statement such as "the mean gender is 1.56" has no meaning; report percentages instead.
Leaving every variable as Scale in SPSS or PSPP. Declare the correct Measure from the start.
Forgetting to reverse-code reverse-worded items. This mistake makes Cronbach's alpha unusually low and can produce negative corrected item-total correlations.
Collecting a continuous variable as groups when there is no need to, which loses information and limits the analysis techniques you can use.
Frequently asked questions
Is an age-group variable (18–22, 23–27, ...) ordinal or nominal?
It is ordinal, because the groups have an order. When you use it as a grouping variable in a t-test or ANOVA, however, SPSS only needs to know that it is categorical.
Can a single Likert item be the dependent variable in a regression?
Avoid it. A single item has few response options and a large measurement error. Use a multi-item scale and take the mean score, or use SEM to model the latent construct.
Should the scale have a "Neutral" midpoint?
Usually yes, because respondents may genuinely have no clear opinion, and forcing them to choose agree or disagree can introduce bias. If you drop the midpoint, have a clear reason and apply the choice consistently across the whole questionnaire.
References
Carifio, J., & Perla, R. J. (2007). Ten common misunderstandings, misconceptions, persistent myths and urban legends about Likert scales and Likert response formats and their antidotes. Journal of Social Sciences, 3(3), 106–116. https://doi.org/10.3844/jssp.2007.106.116
Field, A. (2024). Discovering statistics using IBM SPSS Statistics (6th ed.). SAGE Publications.
Hair, J. F., Black, W. C., Babin, B. J., & Anderson, R. E. (2019). Multivariate data analysis (8th ed.). Cengage Learning.
Jamieson, S. (2004). Likert scales: How to (ab)use them. Medical Education, 38(12), 1217–1218. https://doi.org/10.1111/j.1365-2929.2004.02012.x
Likert, R. (1932). A technique for the measurement of attitudes. Archives of Psychology, 22(140), 1–55.
Norman, G. (2010). Likert scales, levels of measurement and the "laws" of statistics. Advances in Health Sciences Education, 15(5), 625–632. https://doi.org/10.1007/s10459-010-9222-y
Osgood, C. E., Suci, G. J., & Tannenbaum, P. H. (1957). The measurement of meaning. University of Illinois Press.
Preston, C. C., & Colman, A. M. (2000). Optimal number of response categories in rating scales: Reliability, validity, discriminating power, and respondent preferences. Acta Psychologica, 104(1), 1–15. https://doi.org/10.1016/S0001-6918(99)00050-5
Stevens, S. S. (1946). On the theory of scales of measurement. Science, 103(2684), 677–680. https://doi.org/10.1126/science.103.2684.677
Weijters, B., Baumgartner, H., & Schillewaert, N. (2013). Reversed item bias: An integrative model. Psychological Methods, 18(3), 320–334. https://doi.org/10.1037/a0032121
Discussion about this post