Recode and Compute Composite Scores in SPSS and PSPP
How to reverse-code reverse-worded items, group a variable with Recode and compute composite scores with the MEAN function in SPSS and PSPP


Key takeaways
Reverse-code a reverse-worded item into a new variable (TRU4R), never into the same variable, and include the rule for the middle value (3 to 3).
Check the recoding with a crosstab and with correlations: TRU4R must correlate positively with the other Trust items.
MEAN.3scores a 4-item scale when at least 3 items are answered; adding and dividing loses every response with one missing item.The
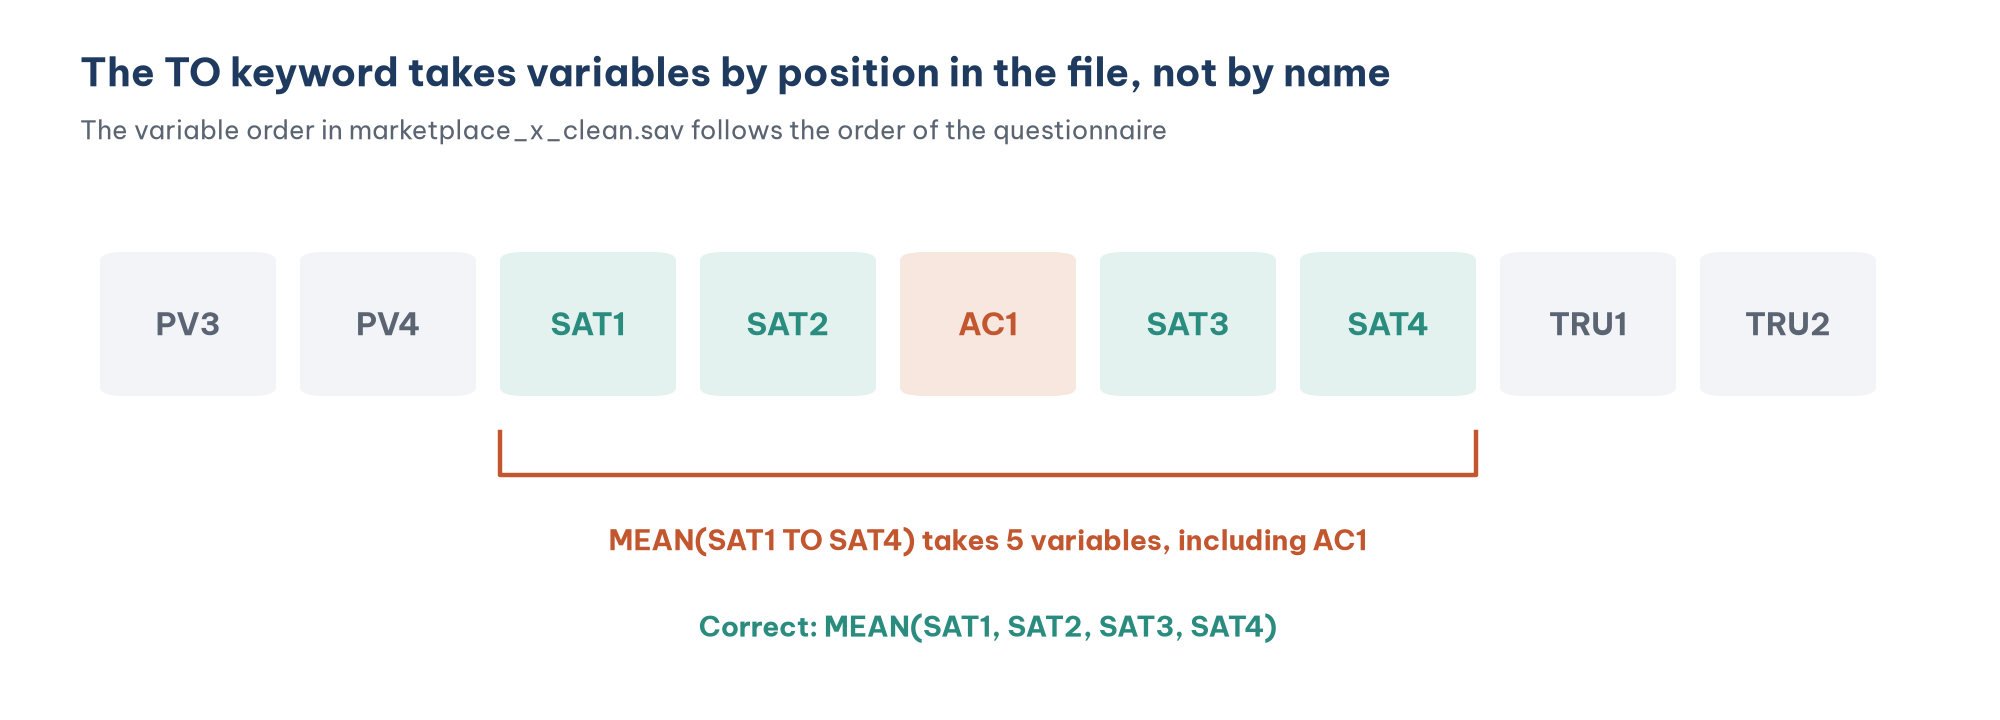
TOkeyword takes variables by position, soSAT1 TO SAT4silently picks up the attention-check item AC1.Group a quantitative variable only to describe the sample; keep the original variable in the analysis.
After data cleaning, the sample data set has 20 Likert items that measure five concepts: Confirmation, Perceived value, Satisfaction, Trust and Repurchase intention. The analyses in later posts, such as correlation, regression, t-tests and ANOVA, need each concept to be represented by a single variable: a composite score, usually the mean of the items in the scale.
Before computing any mean, one job has to be done first: reverse-coding the reverse-worded item. Post 9, "Descriptive Statistics in PSPP (SPSS)" showed that item TRU4, "I worry that marketplace X does not keep its promises", has a mean of only 2.11, while the other three items of the Trust scale are all close to 3.9. If TRU4 is averaged with the other three without reverse-coding, the Trust score is wrong.
This post walks through two commands in PSPP, RECODE and COMPUTE, both through the menus and with syntax, on the data set marketplace_x_clean.sav (267 responses). The steps in SPSS are the same.
Sample data and scripts. The data files and scripts for this post are in the research-data-analysis repository on GitHub (folder
data/andscripts/). Download the whole repository with Code > Download ZIP.
About the screenshots and output. Figures 2 to 5 and 7 are real screenshots of PSPP 2.1.2 on macOS (Apple silicon Mac), taken in November 2026 with
marketplace_x_clean.sav(in thedata/folder of the repository). Figures 6, 8 and 10 to 12 are tables from the PSPP 2.1.2 Output Viewer after running the syntax filecomposite_variables.sps(in thescripts/folder of the repository) (Free Software Foundation, 2026).
1. From questionnaire items to a composite score
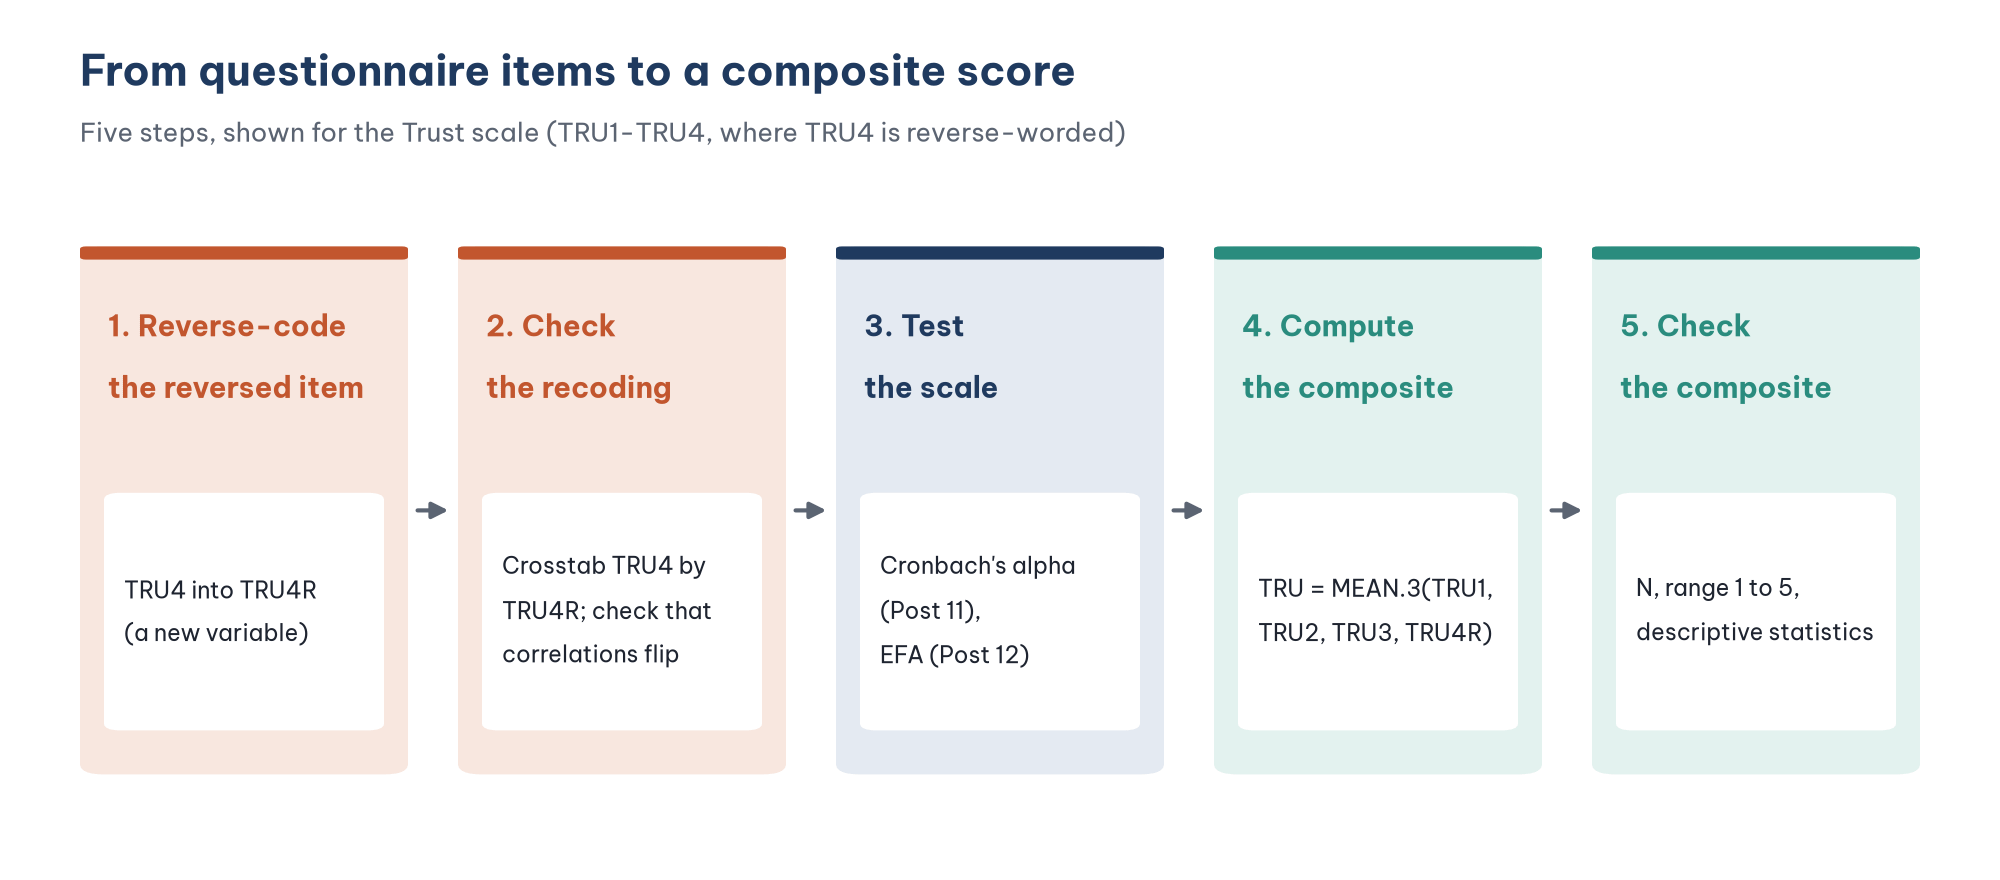
Step 3 sits in the middle of the process for a reason. A composite score only makes sense when the items of the scale really measure the same concept. This is tested with Cronbach's alpha (Post 11, "Cronbach's Alpha in PSPP (SPSS)") and EFA (Post 12, "Exploratory Factor Analysis (EFA) in PSPP (SPSS)"). If a test shows that an item should be removed, the composite score has to be computed again without that item. This post computes the composite scores first to demonstrate the commands, and the syntax file is written so that you only need to change one line to recompute a score.
2. Reverse-coding a reverse-worded item
Why reverse-code?
A reverse-worded item (reversed item) is written in the opposite direction to the concept being measured. In the Trust scale, items TRU1 to TRU3 are worded positively: agreeing means trusting. Item TRU4 is reverse-worded: agreeing means not trusting. Reverse-coding brings TRU4 into line with the other items (Table 1).
On a 1 to 5 scale, the new code is always 6 minus the old code. In general, new code = (lowest value + highest value) − old code. On a 1 to 7 scale, the new code is 8 minus the old code.
Reverse-worded items help to detect careless respondents, as Post 8, "Data Cleaning in PSPP (SPSS)" did to identify the 8 responses that chose the same answer for every item. However, Weijters and Baumgartner (2012) and Suárez-Alvarez et al. (2018) point out that respondents often misread reverse-worded items, especially items with a negation, and that this can lower the reliability of the scale. If you use them, write them clearly and avoid double negatives.
Reverse-coding through the menus
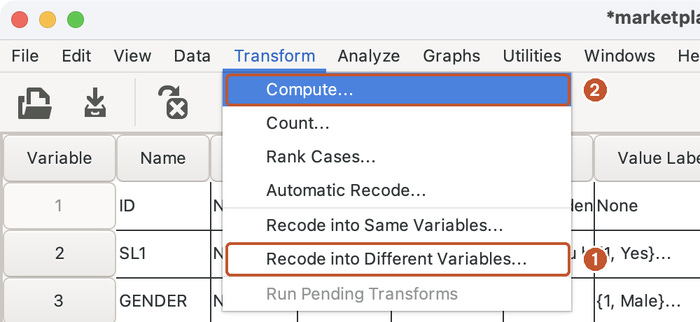
Choose Transform > Recode into Different Variables (Figure 2). Always choose Recode into Different Variables (recode into a new variable), not Recode into Same Variables. Recoding into the same variable overwrites the original data, and if you run it twice by mistake, TRU4 returns to its original codes without you ever noticing.
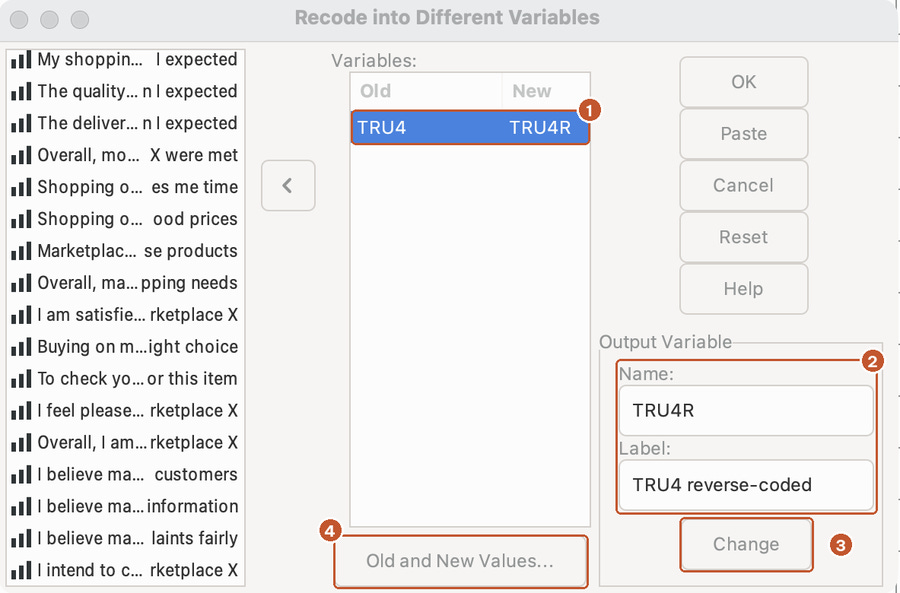
In the Recode into Different Variables dialog (Figure 3):
Select TRU4 in the list on the left and click the arrow button to move it to the Variables box (1). The list shows variable labels, so look for "I worry that marketplace X ...".
Click the TRU4 row you have just moved. In the Output Variable area, type the new name
TRU4Rin the Name box and a short description in the Label box (2), here "TRU4 reverse-coded".Click Change (3). The New column now shows TRU4R.
Click Old and New Values (4) to define the recoding rules.
In the Old and New Values dialog (Figure 4), for each pair of values: type the old value in the Value box on the left (1), type the new value in the Value box of the New Value area (2), then click Add (3). Repeat for all 5 pairs: 1 to 5, 2 to 4, 3 to 3, 4 to 2, 5 to 1. Check the Old/New list (4), then click Continue (5). The screenshot shows the dialog after the last pair (5 to 1) has been added.
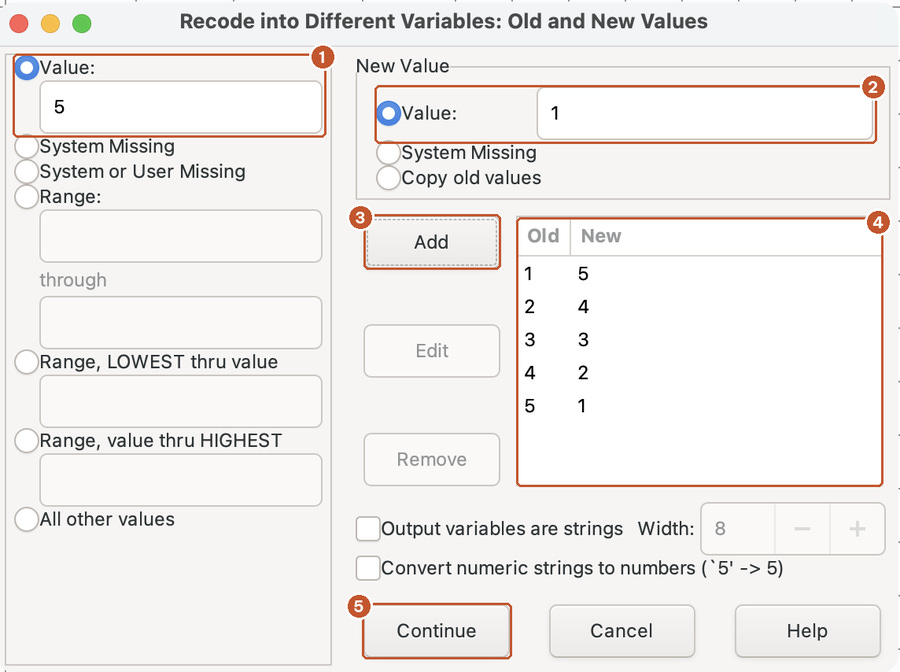
Do not skip the pair 3 to 3. With Recode into Different Variables, every value that is not covered by a rule becomes missing in the new variable. If you forget the pair 3 to 3, the 63 respondents who answered "Neutral" lose their data in TRU4R.
Back in the main dialog, click Paste instead of OK. PSPP opens a Syntax Editor window with the matching commands (Figure 5). Choose Run > All to run them, and save this syntax file.

Reverse-coding with syntax
The file composite_variables.sps is more complete: it also sets the value labels, the format and the level of measurement of the new variable:
RECODE TRU4 (1=5) (2=4) (3=3) (4=2) (5=1) INTO TRU4R.
VARIABLE LABELS TRU4R 'TRU4 reverse-coded: I do NOT worry that marketplace X fails to keep its promises'.
VALUE LABELS TRU4R 1 'Strongly disagree' 2 'Disagree' 3 'Neutral' 4 'Agree' 5 'Strongly agree'.
FORMATS TRU4R (F1.0).
VARIABLE LEVEL TRU4R (ORDINAL).
EXECUTE.
A new variable created by RECODE does not inherit the value labels of the source variable, so you have to declare them again. On a 1 to 5 scale, the short form COMPUTE TRU4R = 6 - TRU4. gives exactly the same result.
Checking the recoding
Always check the result, because a typing mistake such as (2=2) does not produce any error message. There are two quick checks.
A crosstab of the source variable and the new variable. Every response must lie on the anti-diagonal: TRU4 = 1 goes with TRU4R = 5, and so on.
CROSSTABS /TABLES=TRU4 BY TRU4R.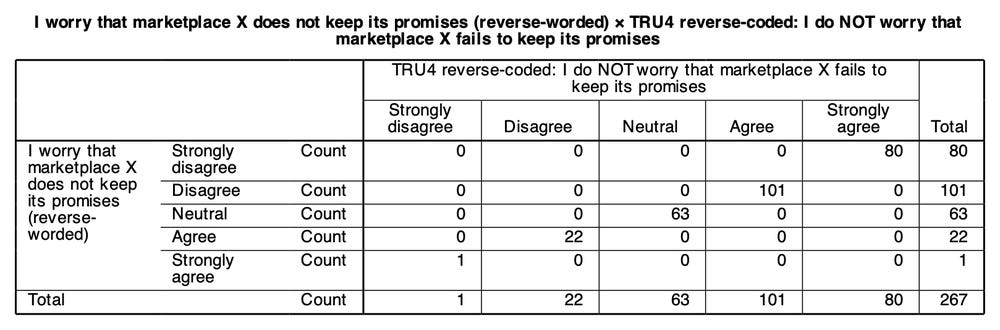
Correlations with the other items of the scale. Before recoding, TRU4 correlates negatively with TRU1, TRU2 and TRU3. After recoding, TRU4R must correlate positively, with the same size:
CORRELATIONS /VARIABLES=TRU1 TRU2 TRU3 TRU4 TRU4R.The correlation table is also a way to detect a reverse-worded item you may have missed: an item that correlates negatively with the other items of the same scale needs a second look at its wording.
3. Computing composite scores with COMPUTE
Through the menus
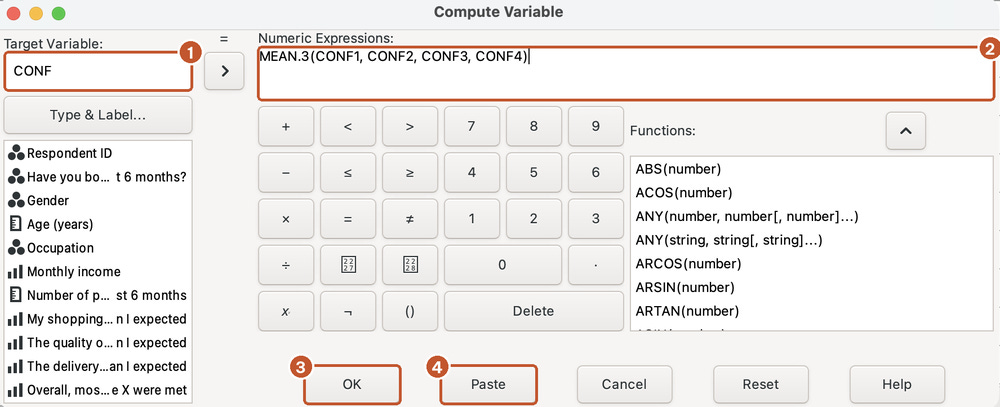
Choose Transform > Compute (Figure 2, item 2). In the Compute Variable dialog (Figure 7):
Type the name of the new variable in the Target Variable box (1), for example
CONF.Type the expression in the Numeric Expressions box (2):
MEAN.3(CONF1, CONF2, CONF3, CONF4). You can also pick the MEAN function from the Functions list and select the variables from the list on the left.Click OK (3), or Paste (4) to get the syntax. The Type & Label button lets you give the new variable a label at the same time.
Three ways to compute a mean, and how they differ
There are three ways to write the formula for a mean. They give the same result for complete responses, but they treat responses with a missing item differently:
COMPUTE CONF_ADD = (CONF1 + CONF2 + CONF3 + CONF4) / 4.
COMPUTE CONF_MEAN = MEAN(CONF1, CONF2, CONF3, CONF4).
COMPUTE CONF_MEAN3 = MEAN.3(CONF1, CONF2, CONF3, CONF4).
Table 3 explains the difference.
Adding and dividing loses 5 responses just because each of them has one missing item. The MEAN function loses no response, but one respondent who answered only 2 of the 4 CONF items is still scored, and that score rests on half of the scale. The MEAN.n function is the compromise: the number n after the dot is the minimum number of items that must be answered.
A common rule is to require answers to at least half to three quarters of the items in the scale. For a 4-item scale, MEAN.3 is a sensible choice. Averaging the answered items is a way of handling missing data at the item level, acceptable when the proportion missing is low and the items of the scale are strongly correlated (Newman, 2014). State the rule you chose in the methods section.
Mean or sum?
You can use the sum instead of the mean (the SUM function), and Pallant (2020) explains both. In business research, the mean is more common for two reasons. First, the mean keeps the 1 to 5 scale, so 3.90 still reads as "close to Agree". Second, means are comparable across scales with different numbers of items. If an item is dropped from a scale in Post 11, the sum changes its range (from 4–20 to 3–15), while the mean stays on 1 to 5.
Another option is a factor score saved from EFA, in which each item has its own weight. DiStefano et al. (2009) show that the simple mean (equal weights) is easy to understand, stable across samples and a common choice when the items have fairly similar loadings.
4. Two common mistakes when computing composite scores
Mistake 1: the TO keyword picks up variables outside the scale
The TO keyword in PSPP and SPSS takes every variable between two variables by their position in the file, not by their names. In the sample data set, the attention-check item AC1 sits between SAT2 and SAT3, exactly where it was in the questionnaire:
The second mistake has the same nature: forgetting to replace TRU4 with TRU4R when computing the Trust score. The syntax file computes both the wrong and the right versions for comparison:
COMPUTE SAT_WRONG = MEAN(SAT1 TO SAT4).
COMPUTE SAT_RIGHT = MEAN(SAT1, SAT2, SAT3, SAT4).
COMPUTE TRU_WRONG = MEAN(TRU1, TRU2, TRU3, TRU4).
COMPUTE TRU_RIGHT = MEAN(TRU1, TRU2, TRU3, TRU4R).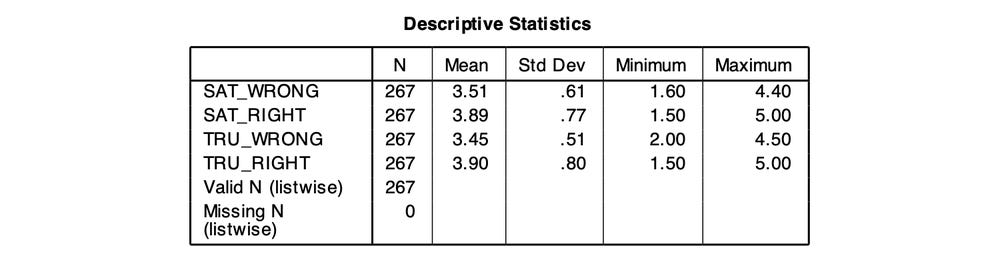
For SAT: the mean falls from 3.89 to 3.51, and the maximum is only 4.40. The reason is that after cleaning, every response has AC1 = 2, so this item pulls everyone's mean towards 2. What is striking is that the correlation between SAT_WRONG and SAT_RIGHT is 1.000. Because AC1 is a constant, SAT_WRONG is just a linear transformation of SAT_RIGHT. Correlation and regression results do not change, but every descriptive figure and every comparison with the neutral value 3 is wrong. This mistake is especially dangerous because it does not spoil any result that looks important.
For TRU: including the unreversed TRU4 adds an item that works "against" the other three. The standard deviation falls from 0.80 to 0.51, and the correlation of the Trust score with item RI1 falls from 0.295 to 0.250 (the file computes these correlations with CORRELATIONS /VARIABLES=SAT_WRONG SAT_RIGHT TRU_WRONG TRU_RIGHT RI1.). In Post 11 you will see that this mistake also lowers Cronbach's alpha sharply.
How to avoid both: list every variable in the MEAN function instead of using TO, and give reversed variables the suffix R so that you do not mix them up.
5. Computing and checking the composite scores for the whole model
The syntax file computes composite scores for all five scales:
COMPUTE CONF = MEAN.3(CONF1, CONF2, CONF3, CONF4).
COMPUTE PV = MEAN.3(PV1, PV2, PV3, PV4).
COMPUTE SAT = MEAN.3(SAT1, SAT2, SAT3, SAT4).
COMPUTE TRU = MEAN.3(TRU1, TRU2, TRU3, TRU4R).
COMPUTE RI = MEAN.3(RI1, RI2, RI3, RI4).
VARIABLE LABELS CONF 'Confirmation (mean of CONF1-CONF4)'
  /PV 'Perceived value (mean of PV1-PV4)'
  /SAT 'Satisfaction (mean of SAT1-SAT4)'
  /TRU 'Trust (mean of TRU1-TRU3, TRU4R)'
  /RI 'Repurchase intention (mean of RI1-RI4)'.
FORMATS CONF PV SAT TRU RI (F4.2).
VARIABLE LEVEL CONF PV SAT TRU RI (SCALE).
DESCRIPTIVES CONF PV SAT TRU RI /STATISTICS=MEAN STDDEV MIN MAX SKEWNESS KURTOSIS.
The three commands after COMPUTE matter just as much. The variable label states which items the composite contains. The F4.2 format shows two decimal places, because COMPUTE creates variables with the default format F8.2. The Scale level of measurement marks the composite as a quantitative variable, unlike the individual Likert items, which are declared Ordinal.
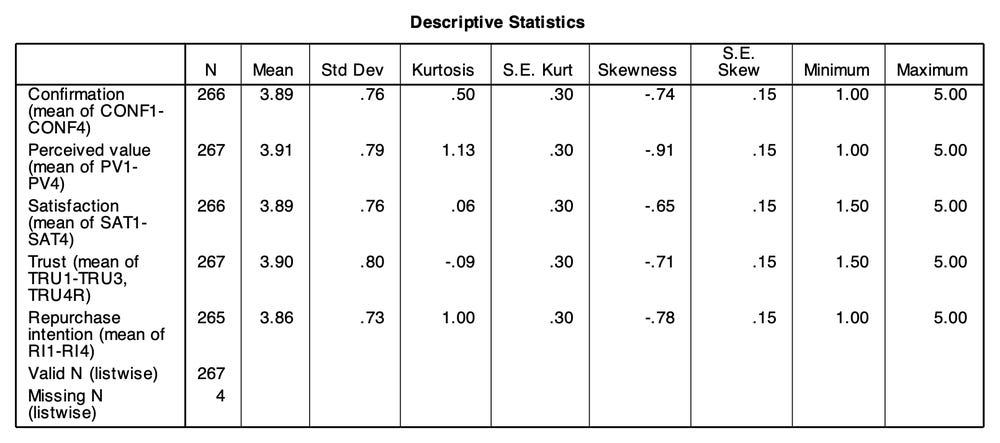
Check three things:
The number of responses (N). CONF, SAT and RI lose 1 to 2 responses each, because those respondents answered fewer than 3 of the 4 items. In total, 4 responses are missing at least one composite score (the "Missing N (listwise)" row; read this row, because the "Valid N (listwise)" row in PSPP 2.1.2 shows 267, not the number of complete responses), so the regression analysis later will use 267 − 4 = 263 responses.
The range. Every variable lies between 1 and 5. A value outside this range points to an error in the formula.
The shape of the distribution. Skewness ranges from −0.91 to −0.65 and kurtosis from −0.09 to 1.13, similar to the individual items in Post 9 and within the ±2 and ±7 limits. Under the stricter ±1 rule, PV (1.13) and RI (1.00) are at the limit for kurtosis. Unlike a Likert item with only 5 values, a 4-item composite can take 17 values (1.00, 1.25, ..., 5.00), plus values such as 3.67 for respondents who answered only 3 items, so it is better suited to analyses meant for quantitative variables.
6. Grouping a quantitative variable with RECODE
RECODE can also turn a quantitative variable into an ordinal one, for example age into age groups to describe the sample:
RECODE AGE (LOWEST THRU 24=1) (25 THRU 34=2) (35 THRU 44=3) (45 THRU HIGHEST=4) INTO AGEGROUP.
VALUE LABELS AGEGROUP 1 '18-24' 2 '25-34' 3 '35-44' 4 '45 and over'.
LOWEST and HIGHEST stand for the smallest and largest possible values (GNU Project, n.d.), so you do not need to know the youngest age in the sample in advance. The response with a missing age (case 59 in Post 8) stays missing in AGEGROUP. Check the group boundaries with the MEANS command:
MEANS TABLES=AGE BY AGEGROUP /CELLS=MIN MAX COUNT.
Result: 73 respondents aged 18–24, 101 aged 25–34, 59 aged 35–44 and 33 aged 45 and over. The syntax file does the same for the number of purchases in the past 6 months (FREQGROUP: 1–2, 3–5, 6–10 and more than 10 times).
An important caution: group a variable only to describe the sample; do not replace the original variable in the analysis. MacCallum et al. (2002) show that splitting a quantitative variable into groups loses information, lowers correlations and reduces the power to detect relationships. Two people aged 25 and 34 are treated as the same, while two people aged 34 and 35 are put in different groups. When you put age into a regression, use the original AGE variable.
7. Saving the analysis file
SAVE OUTFILE='../data/marketplace_x_analysis.sav'
  /DROP=CONF_ADD CONF_MEAN CONF_MEAN3 SAT_WRONG SAT_RIGHT TRU_WRONG TRU_RIGHT.
The file marketplace_x_analysis.sav contains every variable of the clean data set, plus TRU4R, the five composite scores (CONF, PV, SAT, TRU and RI) and the two grouping variables (AGEGROUP and FREQGROUP). The variables that illustrate the wrong computations are dropped. This is the file used in the following analysis posts.
Five common mistakes
Using Recode into Same Variables for a reverse-worded item, which destroys the original data and risks reversing the item twice.
Forgetting the rule for the middle value (3 to 3), so every "Neutral" answer becomes missing in the new variable.
Using TO inside the MEAN function when another variable, such as an attention-check item, sits between the items of the scale.
Computing the composite by adding and dividing, which loses every response with even one missing item.
Computing composites before testing the scales and forgetting to recompute them after an item is dropped in Post 11 or Post 12.
Frequently asked questions
Is Recode in SPSS different from PSPP?
No. The menu names, the dialogs and the RECODE ... INTO syntax are the same. SPSS also has a Transform > Visual Binning dialog for grouping a quantitative variable with a drag-and-drop interface, but the result is equivalent to RECODE with THRU.
Do I need to reverse-code if I will use SmartPLS or AMOS later?
Yes. Both programs work directly with the measurement items, and a reverse-worded item gets a negative loading, which distorts the reliability and convergent validity indices. Export a data file with TRU4R (and without TRU4) before moving to these programs.
How should I name composite scores?
Short, matching the concept's abbreviation in the model (CONF, PV, SAT, TRU, RI) and different from the item names. Avoid reserved keywords such as GT, LT and EQ, listed in Post 6, "Defining and Coding Variables in PSPP (SPSS)". The variable label should state what the composite contains, so that three months later you still know that TRU includes TRU4R, not TRU4.
References
DiStefano, C., Zhu, M., & Mîndrilă, D. (2009). Understanding and using factor scores: Considerations for the applied researcher. Practical Assessment, Research, and Evaluation, 14(20). https://doi.org/10.7275/da8t-4g52
Free Software Foundation. (2026). GNU PSPP (Version 2.1.2) [Computer software]. https://www.gnu.org/software/pspp/
GNU Project. (n.d.). GNU PSPP manual. Retrieved October 30, 2026, from https://www.gnu.org/software/pspp/manual/
MacCallum, R. C., Zhang, S., Preacher, K. J., & Rucker, D. D. (2002). On the practice of dichotomization of quantitative variables. Psychological Methods, 7(1), 19–40. https://doi.org/10.1037/1082-989X.7.1.19
Newman, D. A. (2014). Missing data: Five practical guidelines. Organizational Research Methods, 17(4), 372–411. https://doi.org/10.1177/1094428114548590
Pallant, J. (2020). SPSS survival manual: A step by step guide to data analysis using IBM SPSS (7th ed.). Routledge.
Suárez-Alvarez, J., Pedrosa, I., Lozano, L. M., García-Cueto, E., Cuesta, M., & Muñiz, J. (2018). Using reversed items in Likert scales: A questionable practice. Psicothema, 30(2), 149–158. https://doi.org/10.7334/psicothema2018.33
Weijters, B., & Baumgartner, H. (2012). Misresponse to reversed and negated items in surveys: A review. Journal of Marketing Research, 49(5), 737–747. https://doi.org/10.1509/jmr.11.0368
Discussion about this post