Cronbach's Alpha in SPSS and PSPP: How to Run, Read and Drop Items
How to test scale reliability with Cronbach’s alpha in SPSS and PSPP, read item-total statistics and decide whether an item should go


Key takeaways
Run Cronbach's alpha separately for each scale, after reverse-worded items have been reverse-coded.
Read alpha together with the corrected item-total correlation (0.30 or more) and alpha if item deleted.
A negative item-total correlation usually means an item was not reverse-coded: with the original TRU4, alpha falls to .09; with TRU4R it is .83.
Drop only one item at a time and only for content and statistical reasons, not to gain 0.01 in alpha.
Alpha does not prove unidimensionality or validity; report McDonald's omega as well (here 0.787 to 0.842).
Every construct in a research model is measured with several questions: four items for Satisfaction, four for Trust. Before you combine the items into one composite variable, as in Post 10, "Recoding Variables and Computing Composite Scores in PSPP (SPSS)", you need to answer one question: do these items consistently measure the same thing? If a very satisfied customer answers "Strongly agree" to SAT1 but "Disagree" to SAT3, the mean of the two items does not reflect how satisfied that customer really is.
Cronbach's alpha (Cronbach, 1951) is the most widely used coefficient for this kind of internal consistency. This post shows how to run Cronbach's alpha in PSPP for the five scales of the sample data set (marketplace_x_analysis.sav, 267 responses), how to read each number and how to decide whether any item should be dropped. The example continues the survey on repurchase intention on Marketplace X.
Sample data and scripts. The data files and scripts for this post are in the research-data-analysis repository on GitHub (folder
data/andscripts/). Download the whole repository with Code > Download ZIP.
About the screenshots. Figures 2 to 4 are real screenshots of PSPP 2.1.2 on macOS (Apple silicon Mac), taken in November 2026 with the data file
marketplace_x_analysis.sav(in thedata/folder of the repository). Figures 5 to 7 are real output tables from the syntax filecronbach_alpha.spsin the repository, run in PSPP 2.1.2 and exported from the Output Viewer (Free Software Foundation, 2026).
1. What does Cronbach's alpha measure?
Cronbach's alpha measures internal consistency: how strongly the items of a scale correlate with one another. The formula uses the variance of each item and the variance of the total score:
alpha = k / (k − 1) x (1 − sum of the item variances / variance of the total score)
where k is the number of items. When the items correlate strongly, the variance of the total is much larger than the sum of the item variances, and alpha approaches 1. When the items are unrelated, alpha approaches 0. Alpha can even be negative when an item correlates negatively with the others, as you will see in Section 6.
There are three things alpha does not tell you:
Alpha does not prove that a scale is unidimensional. Cortina (1993) showed that a scale made of two groups of items measuring two different constructs can still have a high alpha if it has enough items. Whether the items measure one construct is a question for EFA (Post 12, "Exploratory Factor Analysis (EFA) in PSPP (SPSS)").
Alpha does not prove that the scale measures the right construct. That is validity, a different issue from reliability. A scale can measure something very consistently that is not Satisfaction.
Alpha is not a fixed property of a scale. Alpha is computed on a particular sample. The same set of items can give different alphas in different samples (Streiner, 2003), so every study must test it again, even when the scale has been used in earlier research.
2. The reliability process
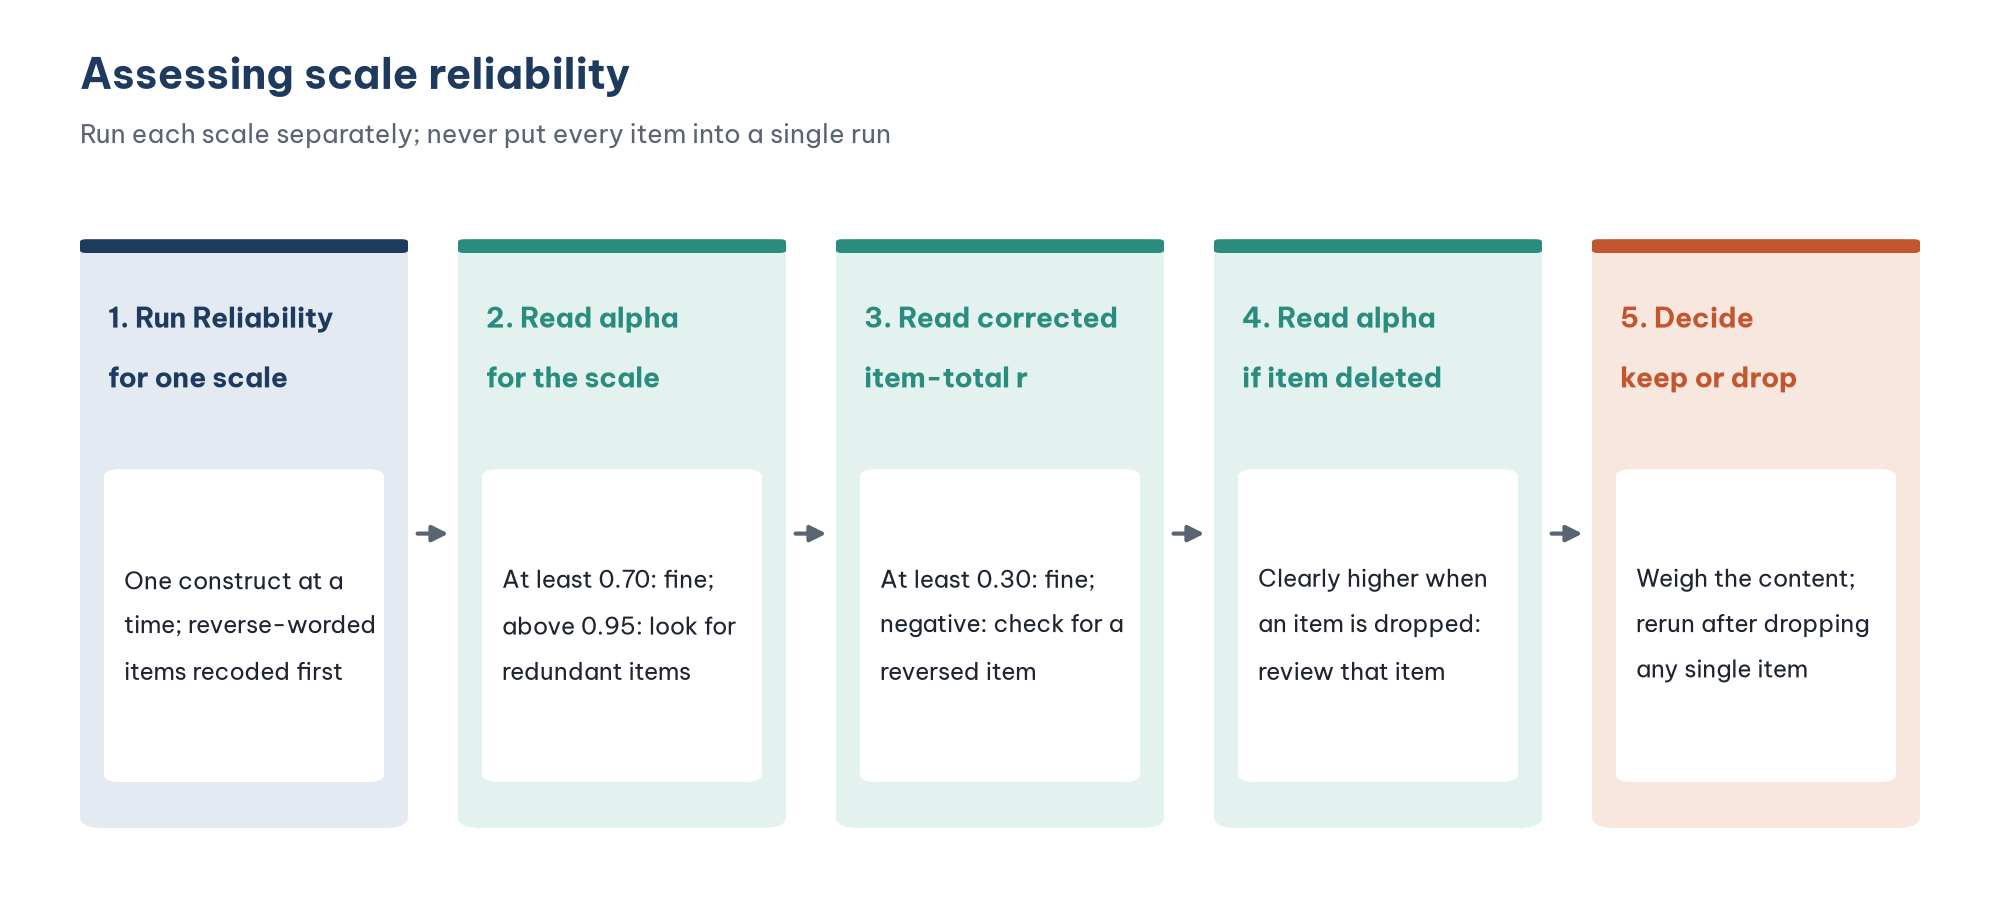
The most important rule: run each scale separately. Putting all 20 items of the 5 constructs into one run gives an alpha that means nothing, because those 20 items were not designed to measure the same thing. In addition, reverse-worded items must be reverse-coded first, as was done with TRU4R in Post 10.
3. Run Cronbach's alpha in PSPP
With the menus
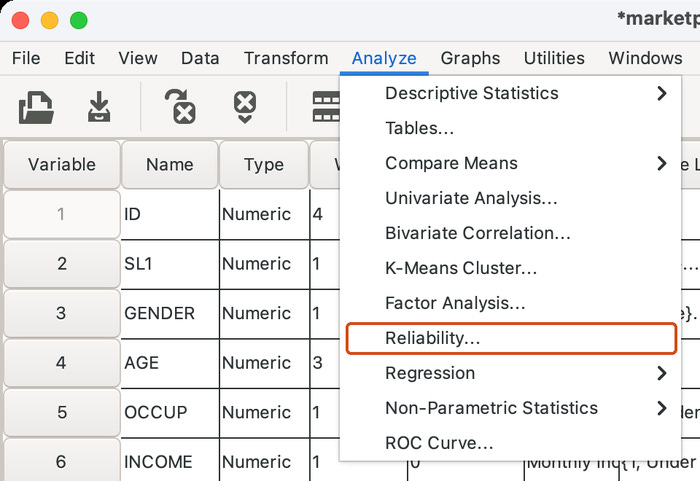
In PSPP, choose Analyze > Reliability (Figure 2). In SPSS, the path is Analyze > Scale > Reliability Analysis.
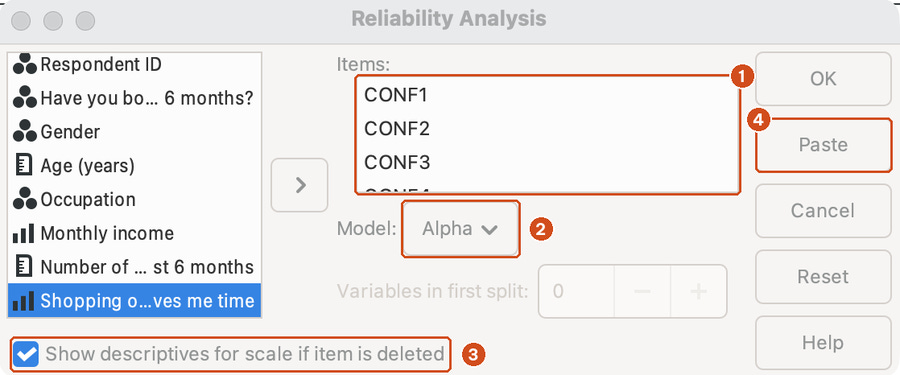
In the Reliability Analysis dialog (Figure 3):
Select the 4 items of the Confirmation scale (CONF1 to CONF4) in the list on the left and click the arrow to move them into the Items box (1). On macOS the Items box is small, so CONF4 is only partly visible; scroll the box to check that all four items are there.
Keep Model set to Alpha (2).
Check Show descriptives for scale if item is deleted (3). This is the most important option: it produces the Item-Total Statistics table that you use to decide whether to drop an item. In SPSS, the matching option is Statistics > Scale if item deleted.
Click Paste (4) to get the syntax, or OK to run the analysis at once.
With syntax
The syntax that PSPP pastes when you click Paste (Figure 4) is very short. The line /SUMMARY = TOTAL corresponds to the check box in step 3.

The file cronbach_alpha.sps in the repository adds /SCALE to give each scale a name in the output. This is convenient when you run the 5 scales one after another:
RELIABILITY /VARIABLES=CONF1 CONF2 CONF3 CONF4 /SCALE('Confirmation') ALL
  /MODEL=ALPHA /SUMMARY=TOTAL.
RELIABILITY /VARIABLES=TRU1 TRU2 TRU3 TRU4R /SCALE('Trust') ALL
  /MODEL=ALPHA /SUMMARY=TOTAL.
4. Read the Cronbach's alpha output
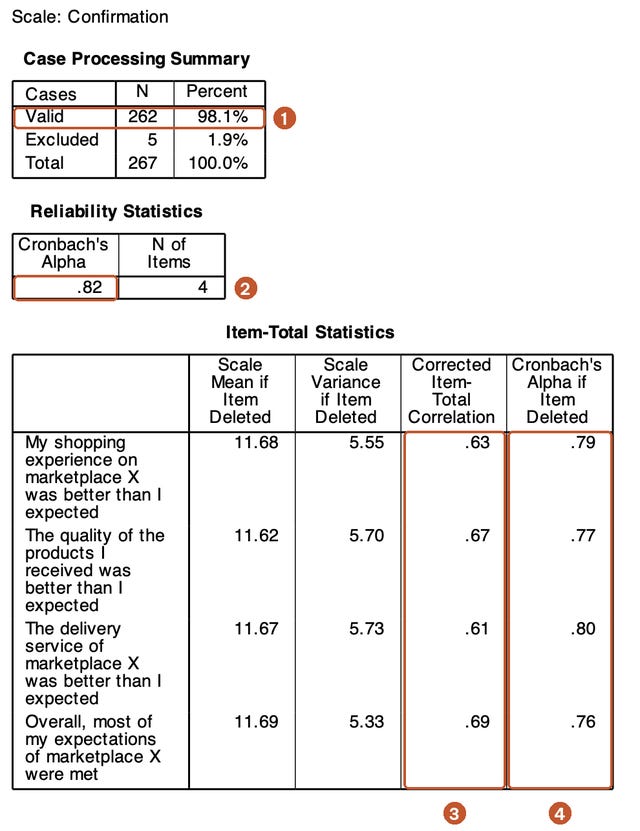
In PSPP 2.1.2, the rows of the Item-Total Statistics table show the variable labels, that is, the wording of each question, in the order of the /VARIABLES list. For the Confirmation scale, the four rows are CONF1 to CONF4.
The Case Processing Summary table: responses used
RELIABILITY uses listwise deletion: a response with a missing value on any of the 4 CONF items is left out of the calculation. The CONF scale uses 262 responses and excludes 5 (1). This number differs from scale to scale, because each scale has a different number of missing cells.
The Reliability Statistics table: the alpha coefficient
The CONF scale has alpha = .82 (2). PSPP shows two decimal places; the full value is 0.824. Table 1 summarizes the thresholds that are most often cited.
Taber (2018) points out that these thresholds are conventions repeated from one citation to the next, not standards with a firm statistical basis. An alpha of 0.69 does not mean the scale is "broken", and an alpha of 0.71 does not mean it is good. Read alpha together with the two columns in the next table.
The Item-Total Statistics table: assess each item
This table has four columns. The two most important are the last two:
Corrected Item-Total Correlation (3) is the correlation between an item and the total of the other items in the scale. "Corrected" means that the item itself is left out of the total; otherwise the correlation would be inflated. The usual threshold is 0.30 or more (Nunnally & Bernstein, 1994). Hair et al. (2019) suggest a stricter threshold of 0.50. The four CONF items have item-total correlations from .61 to .69, so they meet both thresholds.
Cronbach's Alpha if Item Deleted (4) is the alpha of the scale without that item. If this value is clearly higher than the current alpha, the item is lowering the consistency of the scale. For the CONF scale, every value (.76 to .80) is lower than 0.824, meaning that dropping any item would lower alpha. All 4 items are kept.
The first two columns, Scale Mean if Item Deleted and Scale Variance if Item Deleted, are the mean and variance of the total score without that item. They are rarely used to make decisions.
5. Results for all five scales
The syntax file runs the 5 scales in turn. The results are summarized in Table 2.
The alphas with three decimals come from the script compute_omega.py (Section 7); PSPP prints them as .82, .83, .84, .83 and .79. All 5 scales have an alpha of 0.79 or more, every item has an item-total correlation of .57 or more and no item would raise alpha if it were dropped. No item is dropped at this stage.
The item with the lowest item-total correlation
The Perceived value scale is a good example for practicing how to read the table:
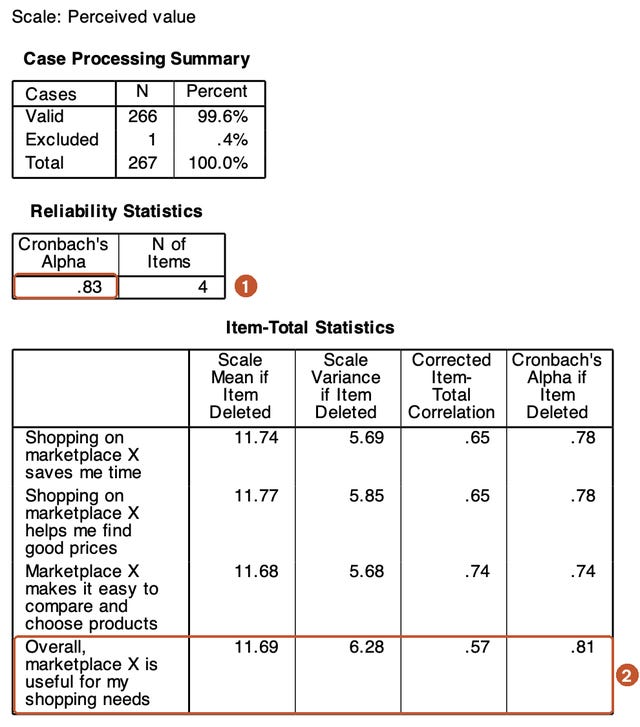
PV4, "Overall, marketplace X is useful for my shopping needs", is the weakest item of the scale, but it is still far above the 0.30 threshold. Dropping PV4 would lower alpha from 0.825 to .81. Moreover, PV4 is a general item that covers the three specific items about time, prices and comparing products. Dropping it would narrow the content of the scale. Keeping PV4 is the right decision on both statistical and content grounds.
6. A reverse-worded item that was not reverse-coded: alpha drops to .09
Post 10 warned that forgetting to reverse-code TRU4 makes alpha drop sharply. The syntax file runs the Trust scale once more with the original TRU4 to show this:
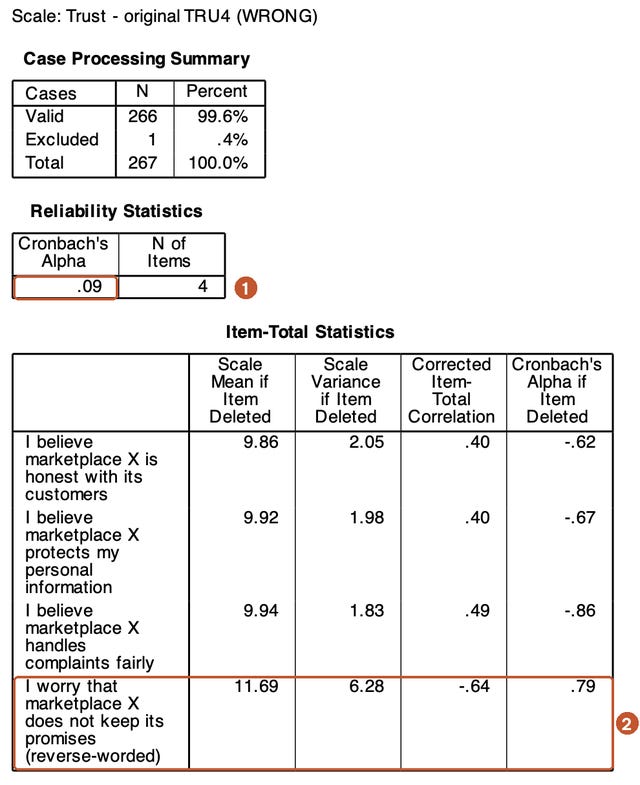
Table 3 compares the two runs.
The output with the original TRU4 seems to "suggest" dropping TRU4: without it, alpha rises from .09 to .79. Many people follow that suggestion and report a 3-item Trust scale. That is the wrong decision. TRU4 is not a poor item; it is only worded in the opposite direction ("I worry that marketplace X does not keep its promises"). After reverse coding, TRU4R contributes as much as the other items (item-total correlation .64), and the scale keeps all 4 items with an alpha of .83.
The rule: when you see a negative item-total correlation, check the wording of the item before you drop it. If it is a reverse-worded item, reverse-code it and run the analysis again. If it is not, there may be a data-entry or coding error.
7. More things to know about alpha
Alpha rises with the number of items
Alpha depends on two things: the mean correlation between the items and the number of items. For the same level of correlation, the more items a scale has, the higher its alpha (Cortina, 1993):
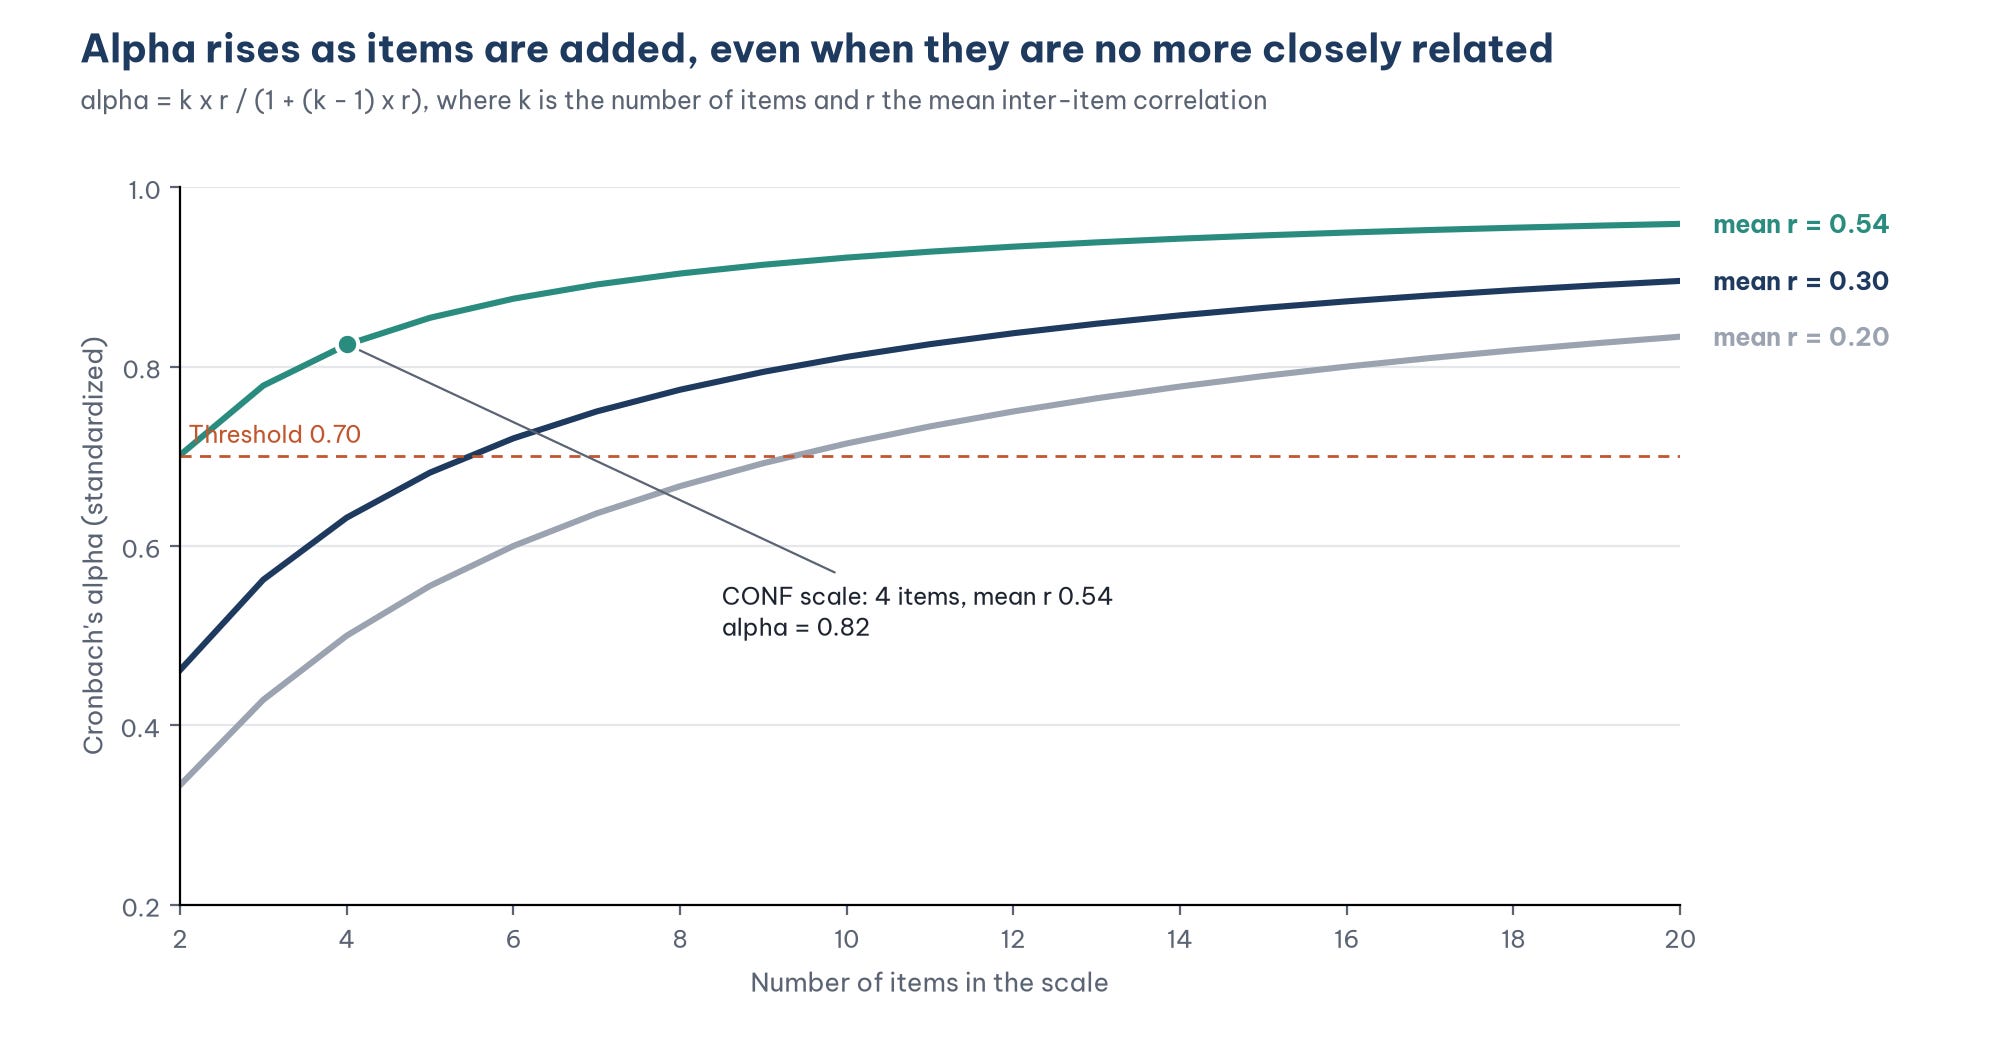
In practice:
A long scale with a high alpha does not necessarily consist of closely related items. Look at the mean inter-item correlation as well. Briggs and Cheek (1986) suggest an optimal range of 0.20 to 0.40. The scales in the sample data have mean inter-item correlations from 0.48 (RI) to 0.57 (SAT), above this range. This is common for the short scales used in business research, whose items are often worded quite similarly.
A scale with 2 or 3 items has difficulty reaching an alpha of 0.70 even when the items correlate fairly well. For short scales, also report the mean inter-item correlation.
After an item is dropped, alpha may fall slightly simply because the scale is shorter.
Alpha and omega
Alpha assumes that every item has the same loading on the construct (the tau-equivalence assumption). When this assumption does not hold, alpha usually underestimates the true reliability. McNeish (2018) and Dunn et al. (2014) therefore recommend also reporting McDonald's omega, which does not require this assumption.
PSPP has no command for omega. The script compute_omega.py in the repository computes omega from the loadings of a one-factor analysis of each scale (Table 4).
Omega is only 0.001 to 0.004 higher than alpha, because the items in each scale have fairly even loadings. The PV scale has the largest difference (0.004), which fits with its loadings having the widest range (0.63 to 0.86). In Post 24, "Composite Reliability (CR) and Average Variance Extracted (AVE)" you will meet this idea again as composite reliability (CR), computed from the loadings in CFA.
Split-half reliability
PSPP also offers the Split-half model, which divides the scale into two halves and computes the correlation between them:
RELIABILITY /VARIABLES=RI1 RI2 RI3 RI4 /SCALE('Repurchase intention') ALL /MODEL=SPLIT(2).For the RI scale, the correlation between the two halves (RI1 and RI2 versus RI3 and RI4) is .66, and the Spearman-Brown coefficient is .79, close to alpha. The result of this model depends on how the scale is split, so alpha (which is, in essence, the average of all possible splits) is used more often.
8. When should you drop an item?
No item needs to be dropped in the sample data, but with real data you will meet this situation. An item should be considered for removal when it shows one of these signs:
A corrected item-total correlation below 0.30.
An alpha if item deleted that is clearly higher than the current alpha (for example from 0.72 to 0.80, not from 0.824 to 0.826).
Before you drop an item, consider three things:
Content. Does the item measure an important aspect of the construct? Dropping it may narrow the content of the scale.
Items left. A scale should have at least 3 items. With 2 items, alpha says little, and the CFA in Post 22, "Confirmatory Factor Analysis (CFA) in JASP" is hard to estimate.
Cause. Check for reverse-worded items, coding errors or an item that respondents misunderstood because of its wording.
If you decide to drop an item, drop only one item at a time, then run the analysis again. Alpha if item deleted assumes that only that one item is removed, so you cannot drop two items at once on the basis of a single table. Afterwards, update the composite variable formula from Post 10, and state in your report which item was dropped and why.
9. Report the results
The reliability table in a thesis usually combines all 5 scales (Table 5).
Sample paragraph: "Cronbach's alpha showed that all five scales were reliable, with alpha coefficients from 0.786 (Repurchase intention) to 0.841 (Satisfaction), above the 0.70 threshold (Nunnally & Bernstein, 1994). The corrected item-total correlations of the items ranged from 0.57 to 0.74, all above 0.30, and no item would increase alpha if deleted. Item TRU4 was reverse-coded before the analysis. McDonald's omega ranged from 0.787 to 0.842, close to alpha. All 20 items were retained for exploratory factor analysis."
Five common mistakes
Running alpha for all items at once instead of for each scale separately.
Dropping a reverse-worded item because of its negative item-total correlation instead of reverse-coding it and running the analysis again.
Dropping several items at once on the basis of a single Item-Total Statistics table.
Dropping an item to raise alpha by 0.01 when alpha is already acceptable, which removes content from the scale for no real benefit.
Treating a high alpha as proof that the scale is unidimensional, and skipping EFA.
Frequently asked questions
My alpha is only 0.65. Do I have to drop the scale?
Not necessarily. Look at the Item-Total Statistics table for items with a low item-total correlation, check for reverse-worded items and look at the mean inter-item correlation. For a newly developed scale or exploratory research, an alpha from 0.60 may be acceptable (Hair et al., 2019), but state it clearly as a limitation of the study.
The scale has already been validated in earlier studies. Do I still need to run alpha?
Yes. Alpha depends on the sample, and a scale that has been translated or used in a different context may be understood differently from the original. Every study should report alpha for its own data.
Should I run Cronbach's alpha or EFA first?
In many theses, the usual practice is to run alpha first to drop items with low item-total correlations, then run EFA. The reverse order is also reasonable: EFA shows which items belong to which factor, and alpha then assesses the reliability of each factor. What matters is that you run alpha again if EFA changes the items of a scale.
References
Briggs, S. R., & Cheek, J. M. (1986). The role of factor analysis in the development and evaluation of personality scales. Journal of Personality, 54(1), 106–148. https://doi.org/10.1111/j.1467-6494.1986.tb00391.x
Cortina, J. M. (1993). What is coefficient alpha? An examination of theory and applications. Journal of Applied Psychology, 78(1), 98–104. https://doi.org/10.1037/0021-9010.78.1.98
Cronbach, L. J. (1951). Coefficient alpha and the internal structure of tests. Psychometrika, 16(3), 297–334. https://doi.org/10.1007/BF02310555
Dunn, T. J., Baguley, T., & Brunsden, V. (2014). From alpha to omega: A practical solution to the pervasive problem of internal consistency estimation. British Journal of Psychology, 105(3), 399–412. https://doi.org/10.1111/bjop.12046
Free Software Foundation. (2026). GNU PSPP (Version 2.1.2) [Computer software]. https://www.gnu.org/software/pspp/
Hair, J. F., Black, W. C., Babin, B. J., & Anderson, R. E. (2019). Multivariate data analysis (8th ed.). Cengage Learning.
McNeish, D. (2018). Thanks coefficient alpha, we'll take it from here. Psychological Methods, 23(3), 412–433. https://doi.org/10.1037/met0000144
Nunnally, J. C., & Bernstein, I. H. (1994). Psychometric theory (3rd ed.). McGraw-Hill.
Streiner, D. L. (2003). Starting at the beginning: An introduction to coefficient alpha and internal consistency. Journal of Personality Assessment, 80(1), 99–103. https://doi.org/10.1207/S15327752JPA8001_18
Taber, K. S. (2018). The use of Cronbach's alpha when developing and reporting research instruments in science education. Research in Science Education, 48(6), 1273–1296. https://doi.org/10.1007/s11165-016-9602-2
Discussion about this post