Mediation Analysis with JASP: Bootstrapping Specific Indirect Effects
Define specific indirect effects in free JASP, run a 2000-sample bootstrap, read percentile confidence intervals and classify the mediation after Zhao et al.


Key takeaways
Software usually prints only the total indirect effect; define each specific indirect effect as a product of labeled paths.
Judge an indirect effect by its bootstrap confidence interval, not by the Sobel test or a bootstrap p-value.
All three indirect paths are significant while the direct effect is not (beta = 0.091): indirect-only mediation.
The path through perceived value sits close to the threshold; its lower bound moves with the seed, the missing-data method and the interval type.
Fix the method and the seed before looking at the results, and report both.
Post 27, "Hypothesis Testing in SEM with JASP" concluded that hypothesis H4 (expectation confirmation has a direct effect on repurchase intention) is not supported, while the total effect of expectation confirmation is still large. The next question is: which route does that effect travel along, and is each route significant? That is the subject of mediation analysis.
This post splits the effect of expectation confirmation on repurchase intention into three indirect paths, tests each path with bootstrapping, classifies the type of mediation and shows a lesson that is rarely mentioned: for an indirect effect close to the threshold, the conclusion can change with the way the confidence interval is computed.
Sample data and scripts. The data files and scripts for this post are in the research-data-analysis repository on GitHub (folder
data/andscripts/). Download the whole repository with Code > Download ZIP.
About the figures and numbers. The screenshots come from JASP 0.99.0 (JASP Team, 2026) on macOS, continuing the SEM analysis of Post 27 on the data file
marketplace_x_sem.sav(267 respondents, FIML). All numbers in Sections 4 and 5 are those JASP printed in this run (2000 bootstrap samples, percentile intervals, random seed 2026). The numbers were checked with the lavaan package for R (Rosseel, 2012), using the scriptmediation_bootstrap.Rin the repository, also with 2000 bootstrap samples; Section 6 and the unstandardized coefficients come from that script and the text says so.
1. Direct, indirect and total effects
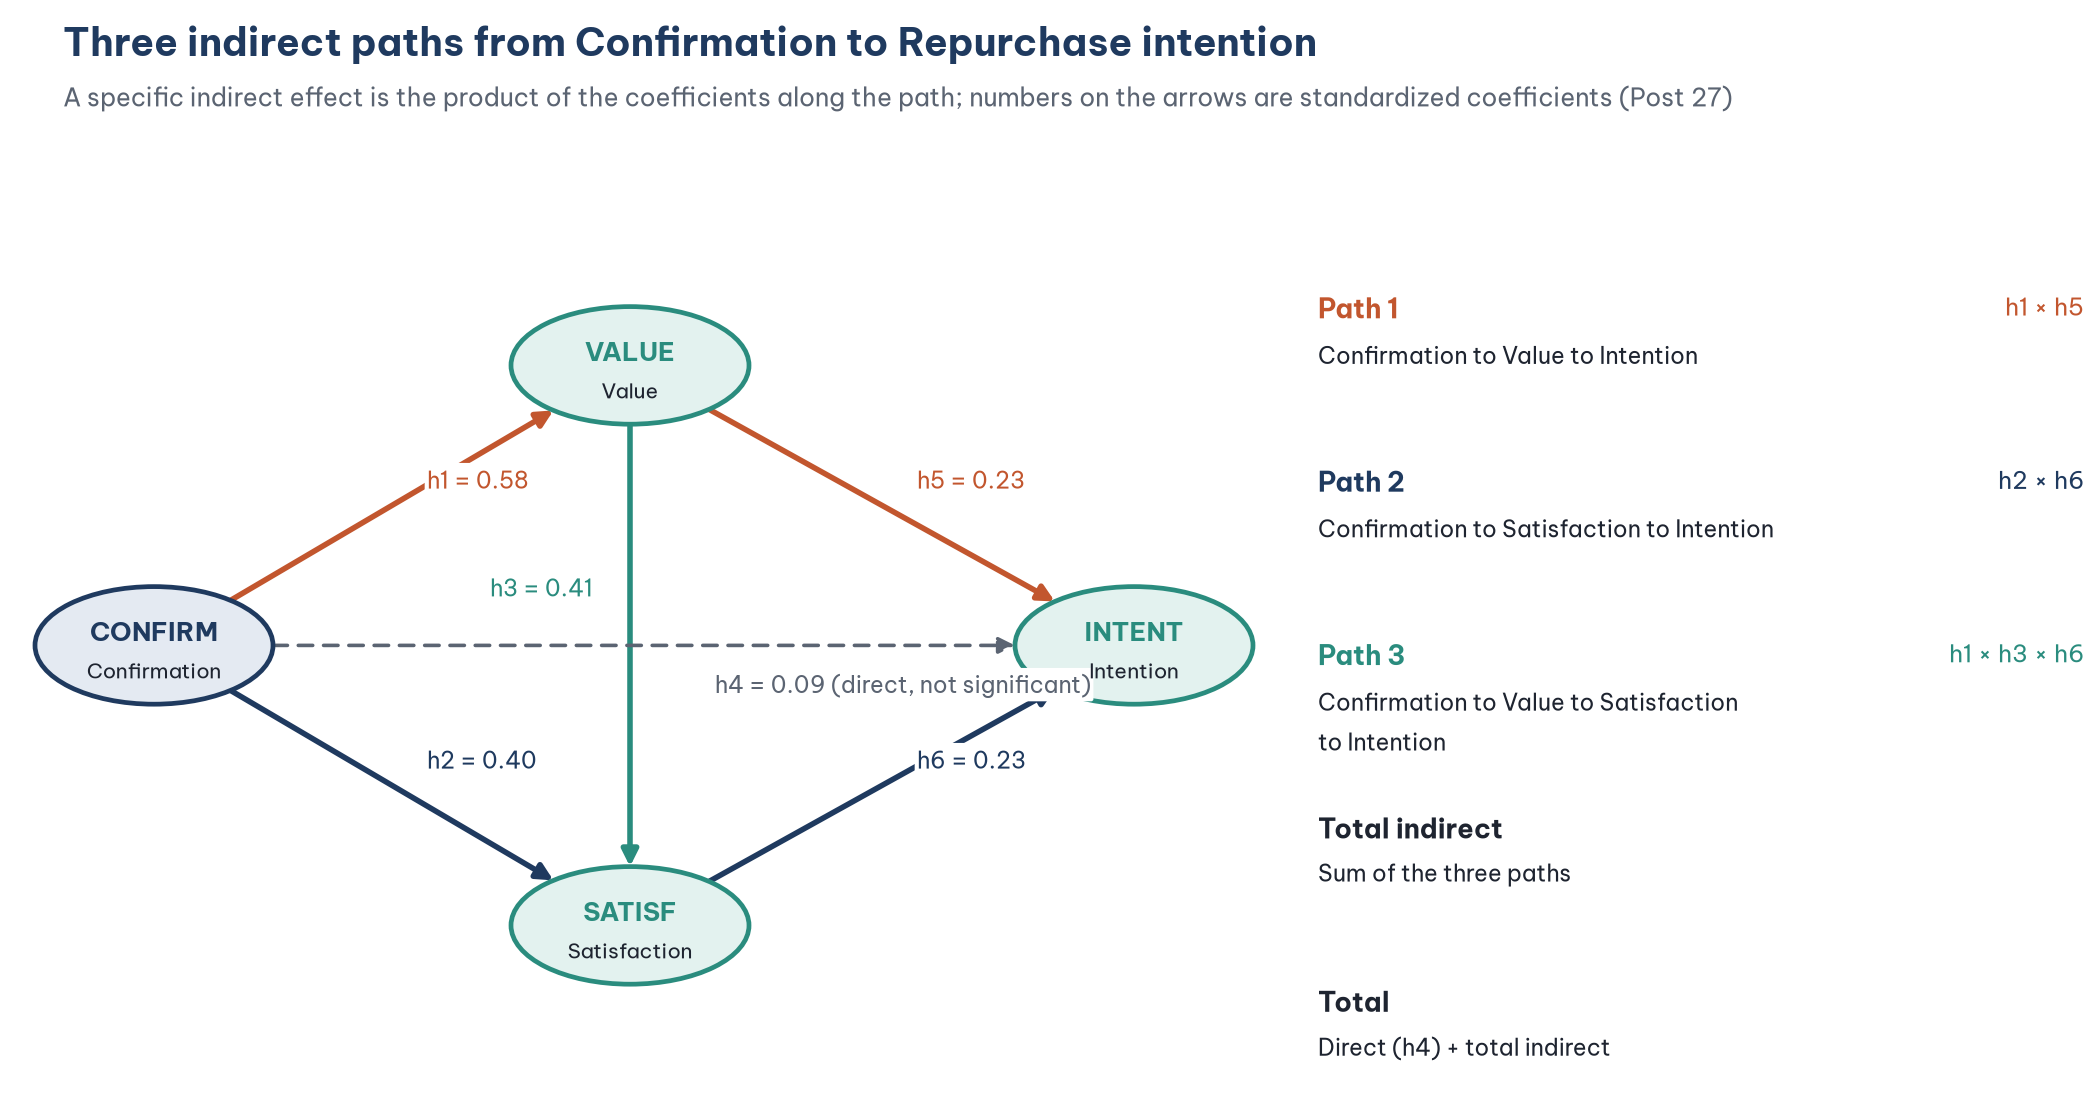
In the Marketplace X model, expectation confirmation (CONFIRM) reaches repurchase intention (INTENT) along four routes:
A specific indirect effect is the product of the coefficients along one path. Software usually prints only the total indirect effect; to know which path is significant, you have to define each product yourself.
2. Why bootstrapping?
The product of two coefficients is not normally distributed, even when each coefficient is: the distribution of the product is usually skewed. The Sobel test (the delta method) assumes normality and is therefore inaccurate, especially in small and medium samples (Preacher & Hayes, 2008). Bootstrapping does not need this assumption: it draws 2000 samples with replacement, computes the product in each sample and takes the 2.5th and 97.5th percentiles as the confidence interval. An indirect effect is significant when the confidence interval does not contain 0.
There are two common types of bootstrap confidence interval:
Percentile: takes the percentiles directly. Simple, and recommended in recent work because it controls the Type I error rate better (Hayes, 2022).
Bias-corrected (BC): corrects for bias in the bootstrap distribution. It has more power but sometimes gives a Type I error rate above the nominal level (Fritz et al., 2012).
Do not rely on the bootstrap p-value when the software prints one (JASP and lavaan compute it from the bootstrap standard error with a normal approximation); base the conclusion on the confidence interval.
3. Define the indirect effects and run the bootstrap in JASP
Open the SEM analysis of Post 27 (labels h1 to h7 are already in place) and replace the defined parameter at the end of the syntax with the lines below. The complete model is:
CONFIRM =~ CONF1 + CONF2 + CONF3 + CONF4
VALUE =~ PV1 + PV2 + PV3 + PV4
SATISF =~ SAT1 + SAT2 + SAT3 + SAT4
TRUST =~ TRU1 + TRU2 + TRU3 + TRU4R
INTENT =~ RI1 + RI2 + RI3 + RI4
# Structural model with labels h1 to h7
VALUE ~ h1*CONFIRM
SATISF ~ h2*CONFIRM + h3*VALUE
INTENT ~ h4*CONFIRM + h5*VALUE + h6*SATISF + h7*TRUST
CONFIRM ~~ TRUST
CONFIRM + VALUE + SATISF + TRUST + INTENT ~ 0*1
# Specific indirect effects
CONF_PV_RI := h1*h5
CONF_SAT_RI := h2*h6
CONF_PV_SAT_RI := h1*h3*h6
PV_SAT_RI := h3*h6
# Total indirect and total effects
CONF_RI_indirect := h1*h5 + h2*h6 + h1*h3*h6
CONF_RI_total := h4 + h1*h5 + h2*h6 + h1*h3*h6
diff_PV_SAT := h1*h5 - h2*h6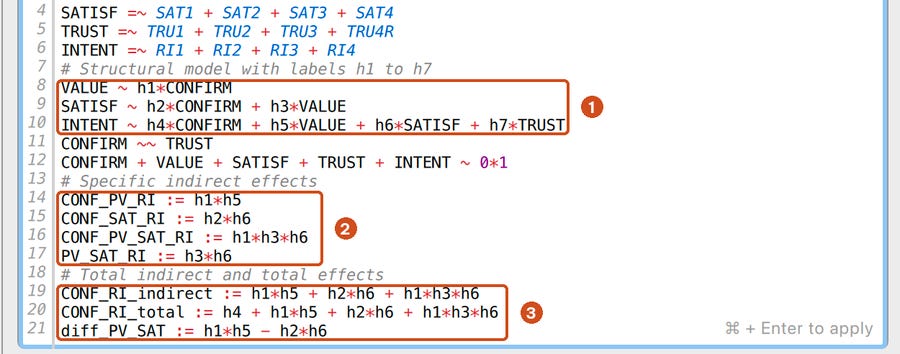
PV_SAT_RI is the indirect effect of perceived value on repurchase intention through satisfaction (used in Section 4). The line CONFIRM + VALUE + SATISF + TRUST + INTENT ~ 0*1 is needed with FIML (Post 26, "Structural Equation Model (SEM) in JASP"). Press Cmd + Enter to apply the syntax.
Then turn on bootstrapping in Estimation Options (Figure 3):
Set Standard errors to Bootstrap.
Enter 2000 in Bootstrap samples and set Type to Percentile (the JASP default is Bias-corrected percentile).
Tick Set a random seed and enter any number (here 2026), so that a rerun gives the same results.
Leave Missing data handling at (FI)ML.
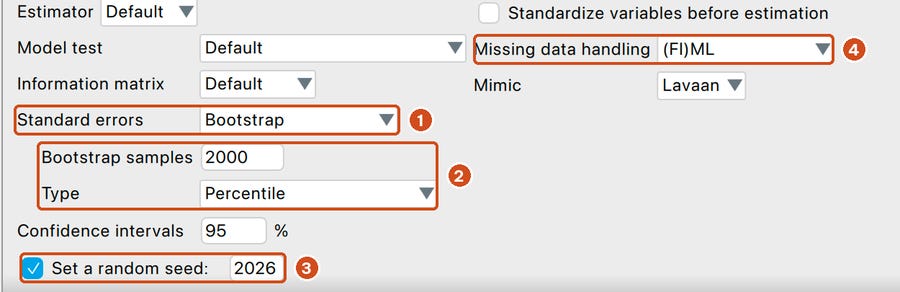
JASP keeps FIML with all 267 respondents when bootstrapping, unlike AMOS, which needs the file of complete respondents. Run time depends on the computer: 2000 samples with this model take from a few minutes to more than half an hour on a slow machine. The SEM > Mediation Analysis module of JASP can also test mediation, but only for observed variables (mean scores), not latent variables; that is why this post uses the SEM module.
In AMOS, bootstrapping needs the complete-case file marketplace_x_sem_complete.sav (254 respondents) with Estimate means and intercepts unticked, because AMOS does not bootstrap data with empty cells. Turn it on in View > Analysis Properties > Bootstrap: tick Perform bootstrap with 2000 samples, Percentile confidence intervals and Bias-corrected confidence intervals (level 95); tick Indirect, direct & total effects on the Output tab and set the seed on the Random # tab. After labeling the paths h1 to h7, click the line Not estimating any user-defined estimand in the lower-left corner of Amos Graphics, choose Define new estimands and type the same products with = instead of := (for example CONF_PV_RI = h1*h5). After the run, View > Text Output > User-defined estimands with Bootstrap Confidence gives the percentile and bias-corrected intervals of each specific indirect effect; Estimates > Matrices > Indirect Effects gives only the total indirect effect. User-defined estimands are available from AMOS 24 onwards.
4. Results
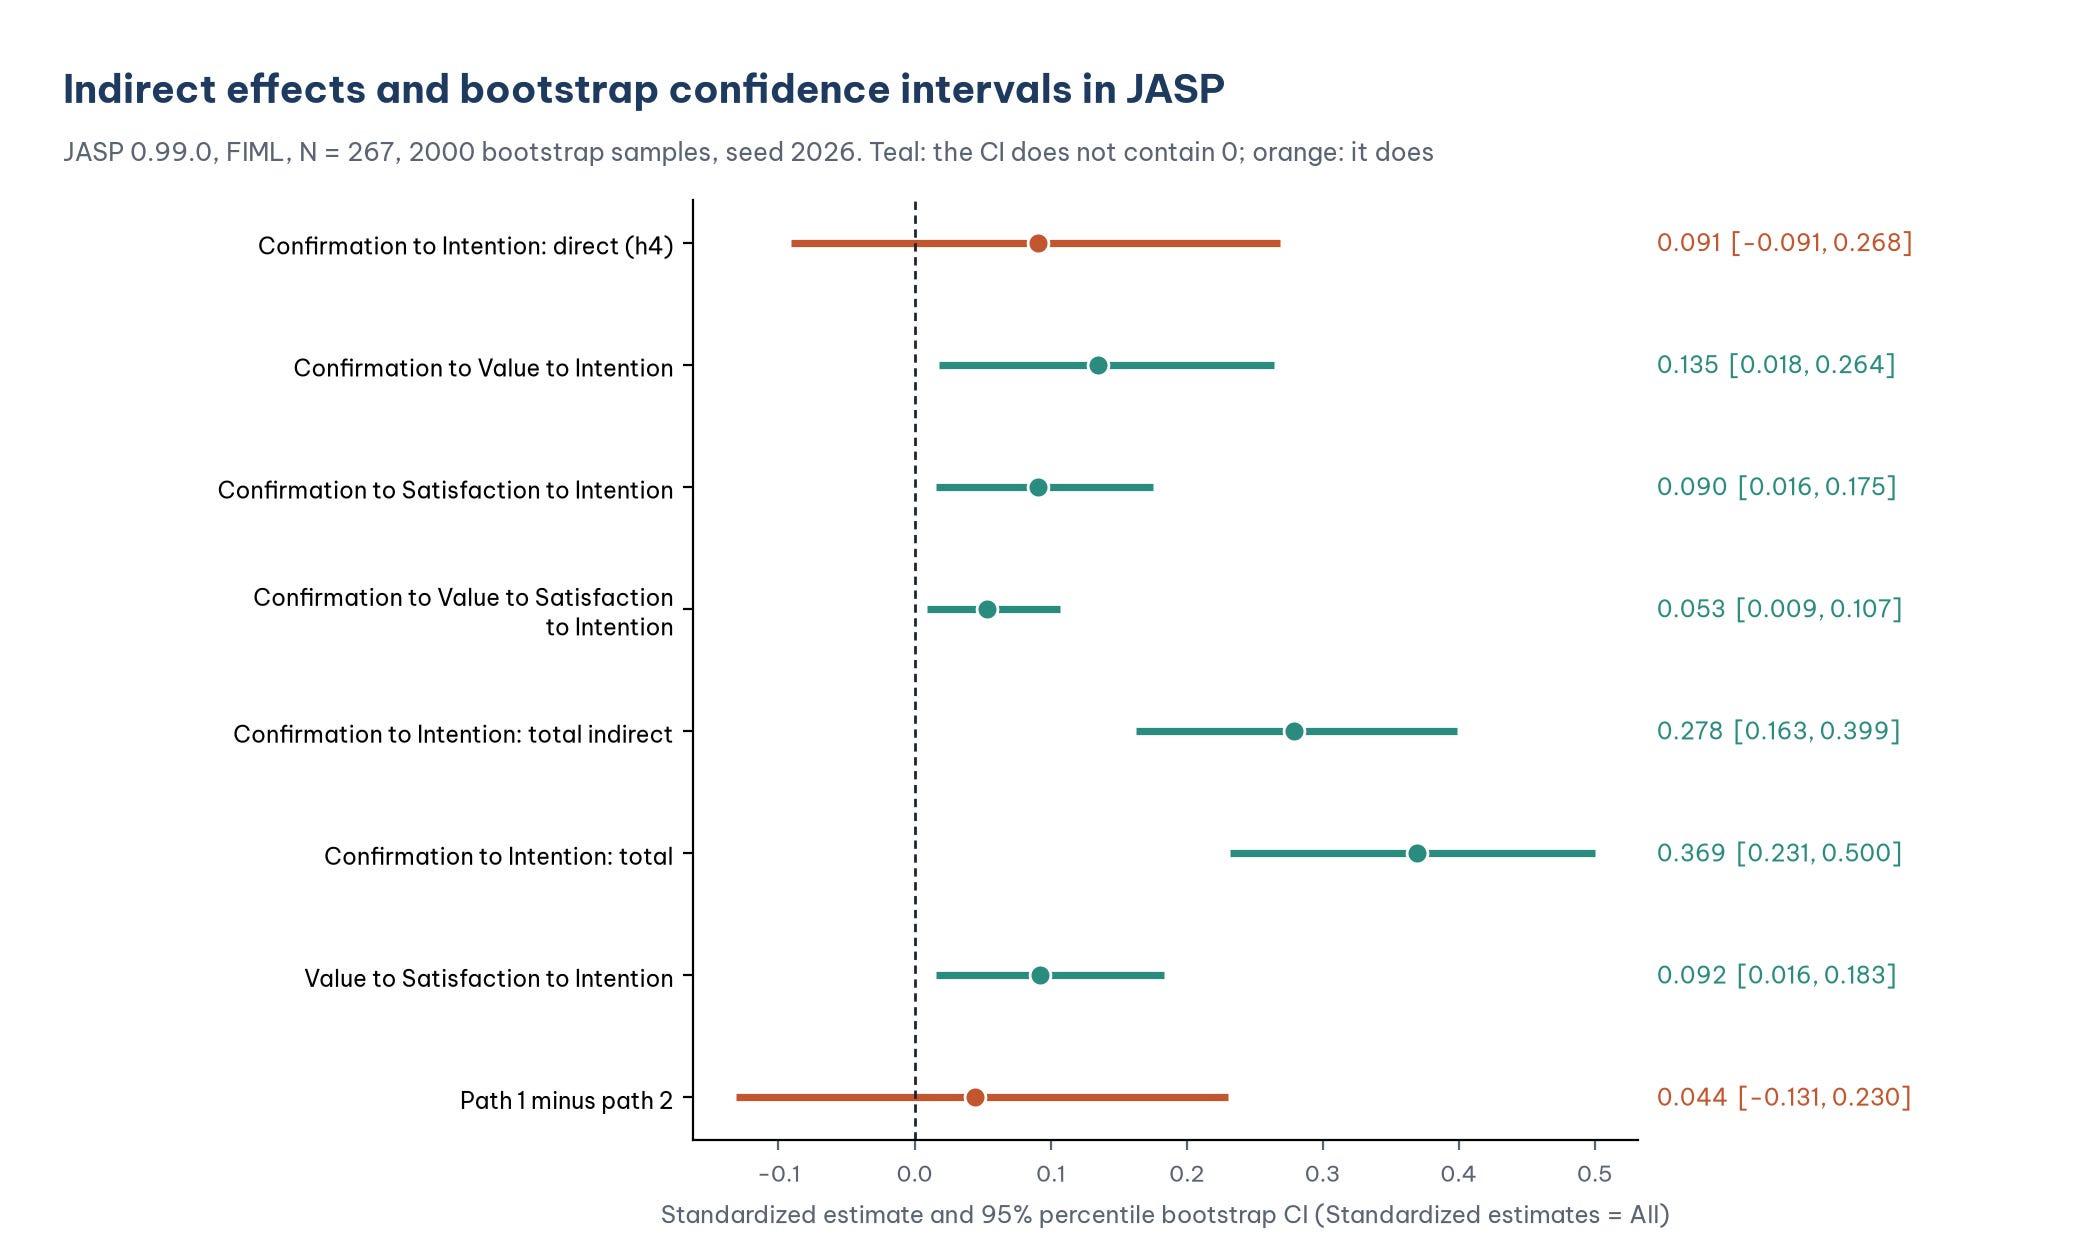
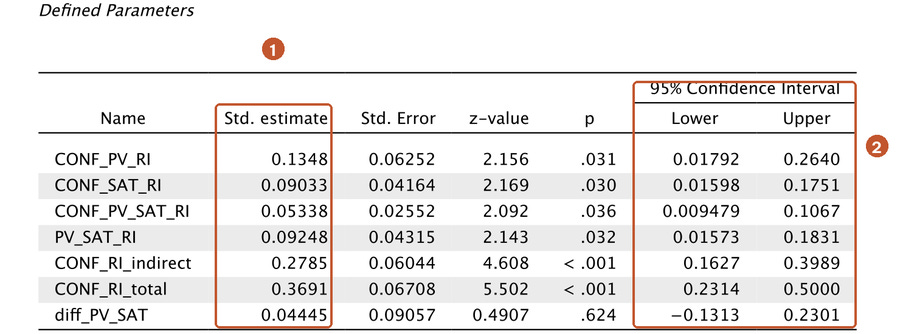
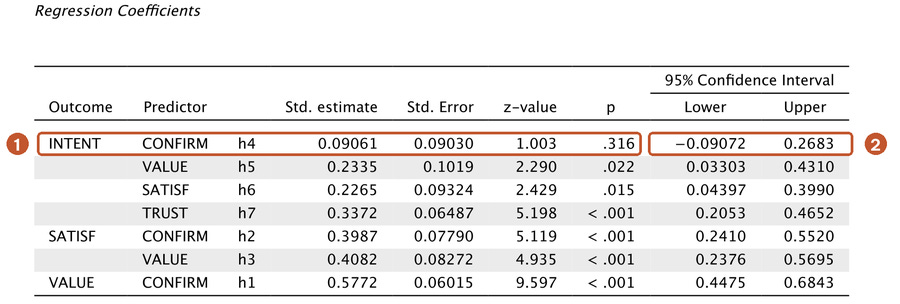
Because Standardized estimates = All is still ticked from Post 27, JASP prints the standardized effects with bootstrap confidence intervals of the standardized values. For the direct effect h4, read the Regression Coefficients table (Figure 6).
The unstandardized effects (B) are printed when Standardized estimates is unticked. lavaan gives B = 0.088 for the direct effect and 0.269 for the total indirect effect, out of a total effect of 0.357. On the 254 complete respondents that AMOS uses, the percentile intervals of the unstandardized effects are [−0.118, 0.262] for the direct effect, [0.003, 0.250] for indirect path 1, [0.019, 0.204] for indirect path 2, [0.013, 0.127] for indirect path 3 and [0.161, 0.426] for the total indirect effect. The two scales and both data sets lead to the same conclusion for every effect.
Three key points:
All three indirect paths are significant, and the total indirect effect (0.278) is about 75% of the total effect (0.369).
The direct effect is not significant (beta = 0.091, p = 0.316, CI [−0.091, 0.268]). Following the classification in Section 5, this is indirect-only mediation (full mediation): expectation confirmation affects repurchase intention through perceived value and satisfaction.
No path is significantly stronger than another. The difference between the path through perceived value and the path through satisfaction is 0.044, p = 0.624, and its confidence interval contains 0. As in Post 27, do not rank indirect paths by eye.
For perceived value: its direct effect on repurchase intention is significant (h5: beta = 0.233, CI [0.033, 0.431] in this run) and its indirect effect through satisfaction is also significant, with the same positive sign. This is complementary mediation (partial mediation).
The bootstrap run changes the standard errors, z-values and p-values of the paths, not the estimates. For example, h4 has p = 0.316 here against 0.372 in the run without bootstrap (Post 27); h5 has p = 0.022 against 0.011. The fit (chi-square = 138.7, df = 162; CFI = 1.000; RMSEA = 0.000; SRMR = 0.035) is the same as in Post 26.
A warning about the R-Squared table. In this bootstrap run, the R-Squared table of JASP 0.99.0 prints −0.179 for VALUE, 0.051 for SATISF and −0.241 for INTENT. These values cannot be correct (R² cannot be negative), and the item rows above them look normal. Read R² from the run without bootstrap (Post 26: 0.333, 0.514 and 0.443), or as 1 minus the standardized residual variance in the Factor Variances table of this run (0.667, 0.486 and 0.557, which give the same 0.333, 0.514 and 0.443).
5. Types of mediation
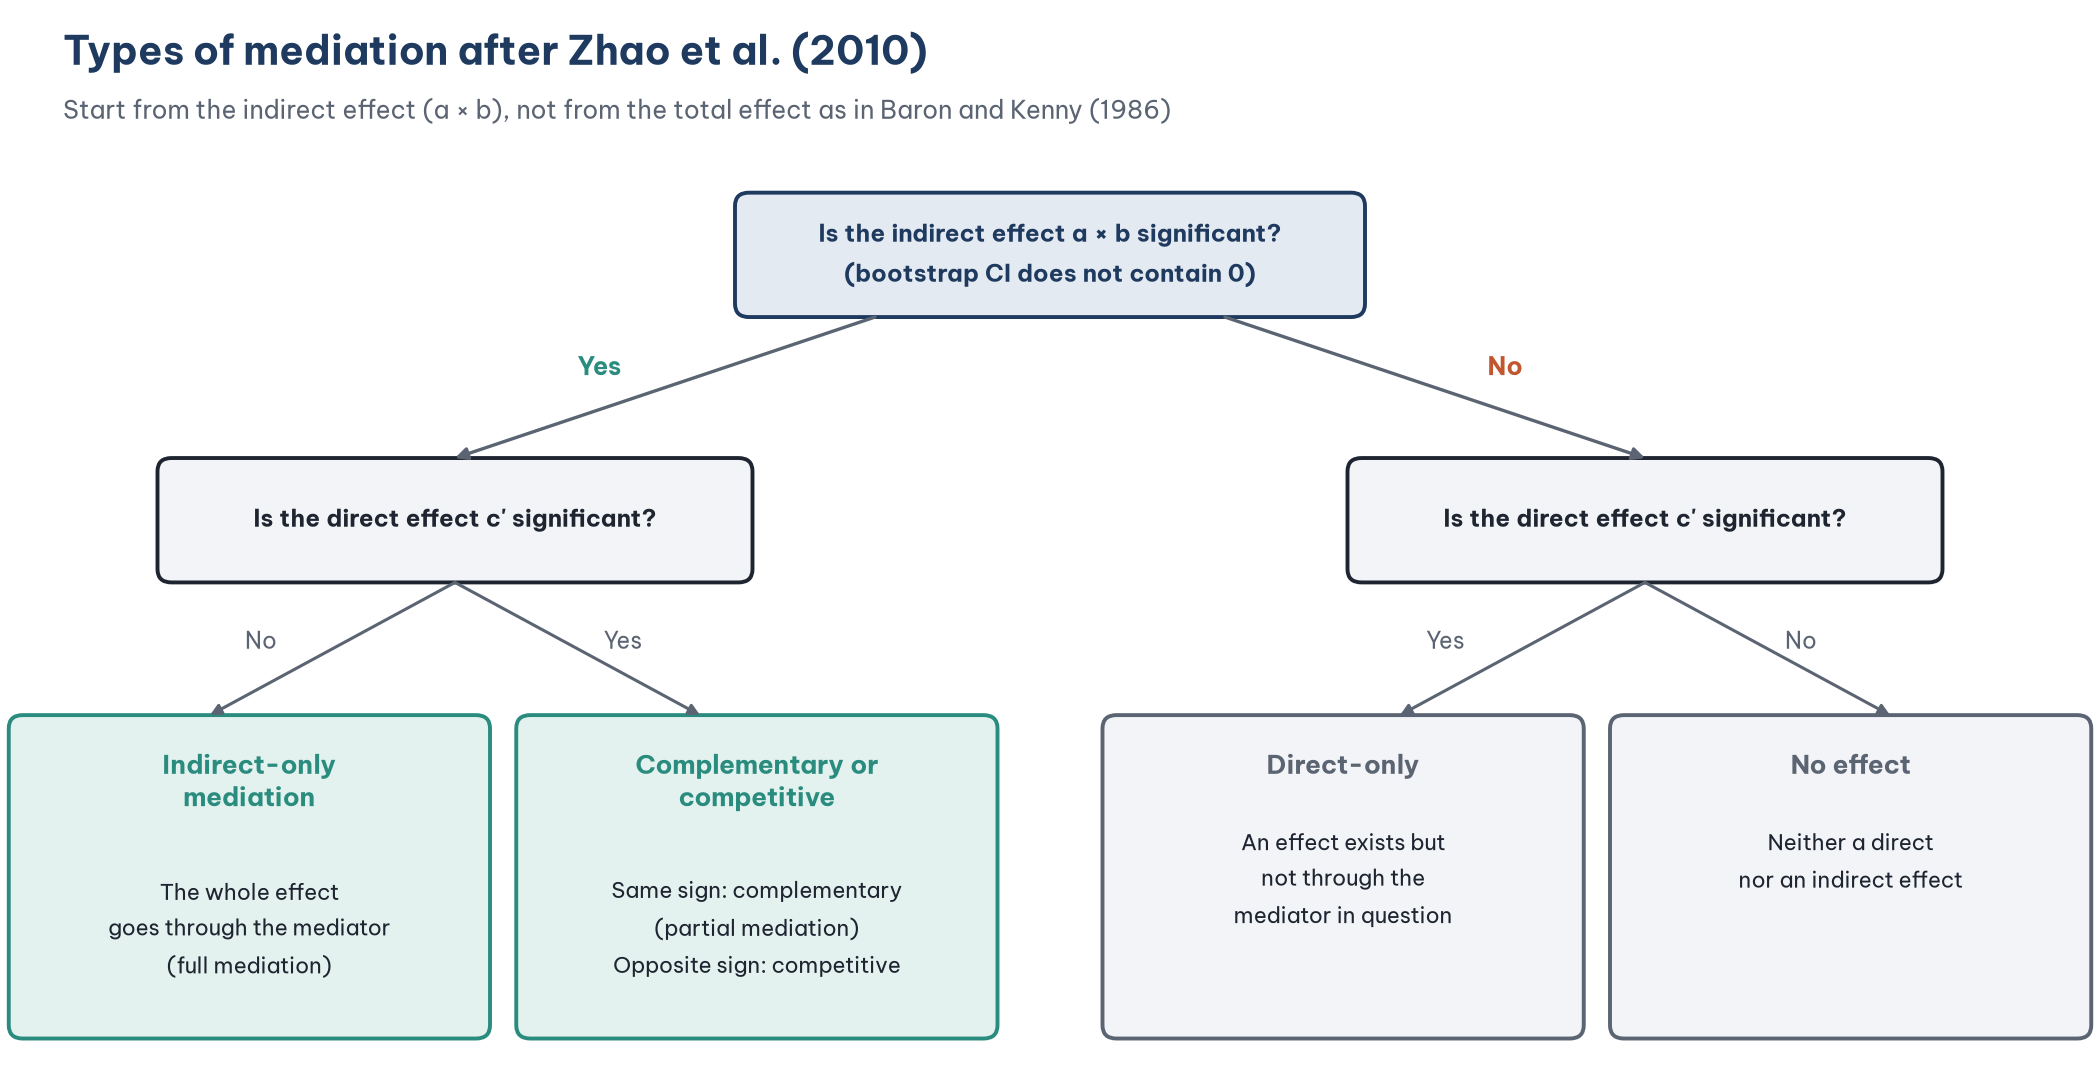
The older approach of Baron and Kenny (1986) requires a significant total effect before mediation is examined, and uses the Sobel test. Zhao et al. (2010) showed that this condition is unnecessary: what matters is whether the indirect effect is significant. The direct effect is then used to classify the mediation:
A note on writing "full mediation": a non-significant direct effect does not prove that it is zero (Posts 17 and 27). With a larger sample, a small direct effect could become significant. Many authors advise describing the result as "the effect works mainly through the mediators" rather than claiming "full" mediation (Hayes, 2022).
6. When the conclusion depends on the method
Indirect path 1 (through VALUE) has a lower bound close to 0. The table compares ways of computing its confidence interval. The first row is the JASP run of Section 4 (standardized); the other rows are unstandardized and come from mediation_bootstrap.R:
In this run every method leads to the same conclusion, but the margin differs a great deal. On the 254 complete respondents (the data AMOS has to use), the percentile interval starts at only 0.003. An earlier run of the same analysis, which drew a different sequence of random bootstrap samples, gave [−0.001, 0.257] for this interval: it touches 0 and would be read as not significant, while its bias-corrected interval [0.005, 0.262] did not. The coefficient h5 (VALUE to INTENT) behaves the same way: its percentile interval on the 254 respondents is [0.006, 0.385] in this run (the lower bound of 0.006 reported in Post 27) and was [−0.001, 0.398] in the earlier run. The result changes with the random seed, the handling of missing data and the type of interval: a sure sign of an effect that is close to the threshold.
How to handle it honestly:
Choose the method before looking at the results (for example FIML, percentile bootstrap, 2000 samples) and keep it.
Report the random seed and the number of bootstrap samples so that others can reproduce the result.
Do not switch to bias-corrected only because the percentile interval is not significant.
Report this indirect path as weak evidence, together with a robustness analysis such as the table above. Paths 2 and 3 are significant with every method.
7. Reporting the results
Indirect effects were tested by bootstrapping with 2000 samples and 95% percentile confidence intervals (FIML, N = 267, random seed 2026). Expectation confirmation had a significant indirect effect on repurchase intention through perceived value (beta = 0.135, 95% CI [0.018, 0.264]), through satisfaction (beta = 0.090, [0.016, 0.175]) and through the chain of perceived value and satisfaction (beta = 0.053, [0.009, 0.107]). The total indirect effect was 0.278 ([0.163, 0.399]), while the direct effect was not significant (beta = 0.091, [−0.091, 0.268]), suggesting that the effect of expectation confirmation on repurchase intention works mainly through the two mediators (Zhao et al., 2010). The difference between the paths through perceived value and through satisfaction was not significant (0.044, [−0.131, 0.230]). The indirect path through perceived value was close to the threshold: its lower bound was 0.018 with FIML and only 0.003 (unstandardized, [0.003, 0.250]) when the analysis was restricted to the 254 complete respondents.
Five common mistakes
Using the Sobel test as the main test of an indirect effect.
Reporting only the total indirect effect when the model has several mediation paths.
Applying the Baron and Kenny condition: stopping the analysis when the total effect is not significant.
Changing the interval type or the seed until the result becomes significant.
Interpreting mediation as causation with cross-sectional data. Mediation is a hypothesis about a mechanism; data from one point in time only show that the data are consistent with that mechanism.
Frequently asked questions
How many bootstrap samples are needed?
2000 to 5000 is common. For a result close to the threshold, such as indirect path 1, 5000 or 10000 samples make the confidence interval more stable from run to run, but they do not turn a weak effect into a strong one.
Does the total effect have to be significant before testing mediation?
No (Zhao et al., 2010; Hayes, 2022). Competitive mediation can make the total effect close to 0 even when both the direct and the indirect effects are substantial.
How is mediation with latent variables different from PROCESS in SPSS?
PROCESS (Hayes, 2022) runs regressions on mean scores and ignores measurement error. SEM with latent variables corrects for that error, so the coefficients are usually larger (Post 19, "What Is AMOS? CB-SEM and When to Use It Instead of SPSS"). Both use the same bootstrap logic.
How do I test moderated mediation?
Moderated mediation means the indirect effect changes with a moderator. Use multigroup analysis (Post 29, "Multigroup Analysis and Moderation with JASP") when the moderator is a grouping variable, or an interaction term in PROCESS or SmartPLS (Post 41, "Moderation Analysis in SmartPLS 4").
References
Baron, R. M., & Kenny, D. A. (1986). The moderator–mediator variable distinction in social psychological research: Conceptual, strategic, and statistical considerations. Journal of Personality and Social Psychology, 51(6), 1173–1182. https://doi.org/10.1037/0022-3514.51.6.1173
Fritz, M. S., Taylor, A. B., & MacKinnon, D. P. (2012). Explanation of two anomalous results in statistical mediation analysis. Multivariate Behavioral Research, 47(1), 61–87. https://doi.org/10.1080/00273171.2012.640596
Hayes, A. F. (2022). Introduction to mediation, moderation, and conditional process analysis: A regression-based approach (3rd ed.). Guilford Press.
JASP Team. (2026). JASP (Version 0.99.0) [Computer software]. https://jasp-stats.org/
Preacher, K. J., & Hayes, A. F. (2008). Asymptotic and resampling strategies for assessing and comparing indirect effects in multiple mediator models. Behavior Research Methods, 40(3), 879–891. https://doi.org/10.3758/BRM.40.3.879
Rosseel, Y. (2012). lavaan: An R package for structural equation modeling. Journal of Statistical Software, 48(2), 1–36. https://doi.org/10.18637/jss.v048.i02
Zhao, X., Lynch, J. G., Jr., & Chen, Q. (2010). Reconsidering Baron and Kenny: Myths and truths about mediation analysis. Journal of Consumer Research, 37(2), 197–206. https://doi.org/10.1086/651257
Discussion about this post