IPMA and Higher-Order Constructs in SmartPLS 4
Use an importance-performance map to find which factors to prioritize, then build and evaluate a reflective-reflective higher-order construct with repeated indicators


Key takeaways
IPMA combines importance (total effect on the target construct) with performance (the mean score rescaled to 0 to 100) to show which factor to prioritize.
In the Marketplace X model, confirmation of expectations has the highest importance (0.312) and the lowest performance (72.08), with item CONF4 as the item to prioritize.
IPMA uses total effects, so a factor whose direct effect is not significant can still be the most important; read the scale of the vertical axis before comparing performance.
In a reflective-reflective higher-order construct, the paths to the lower-order constructs are read as loadings; here AVE is 0.778 and rho_c 0.875.
A higher-order construct needs a theoretical basis established beforehand, not just a wish for a more parsimonious model.
This is the last post of the 42-post series. It introduces two extensions of PLS-SEM (Hair et al., 2022):
IPMA (importance-performance map analysis): turns the model results into managerial recommendations, that is, which factors to prioritize to increase repurchase intention.
Higher-order construct model (HCM): a construct formed from other constructs, instead of being measured directly by items.
Sample data and scripts. The data file and scripts for this post are in the research-data-analysis repository on GitHub (folder
data/andscripts/). Download the whole repository with Code > Download ZIP.
About the figures and numbers. The figures are real screenshots of SmartPLS 4.1.2.1 (Ringle et al., 2026; 30-day trial) for the model
marketplace-x-model(IPMA part) andhcm-model, a copy edited into a higher-order model (HCM part). Data: casewise deletion, 254 respondents. According to the SmartPLS license comparison page, the Student license does not include IPMA. The numbers in this post come from the SmartPLS reports; R (scriptsipma.Randhigher_order.Rin the repository'sscripts/folder, package cSEM) gives the same results to the third decimal place, except where noted. SmartPLS lists constructs and paths in alphabetical order (CONFIRM, INTENT, SATISF, TRUST, VALUE).
Part 1. IPMA
1. The idea
Standard PLS-SEM results tell you the importance of each factor: its total effect on the target construct. IPMA adds a second dimension, performance: the mean score of that factor, rescaled to a range of 0 to 100 (Ringle & Sarstedt, 2016).
Putting the two dimensions together gives a map: the horizontal axis is importance, the vertical axis is performance. A factor in the high importance, low performance corner is the one to prioritize: improving it has the largest effect on the target construct, and it has the most room for improvement.
Data requirements (Ringle & Sarstedt, 2016):
All items point in the same direction: a high score is good. Reverse-worded items must be recoded first (TRU4R in this series was recoded in Post 10).
Items are measured on a metric or quasi-metric scale (a 1 to 5 Likert scale here).
All outer weights are positive.
2. How performance is computed
Step 1. Rescale each item to 0 to 100: new value = (value - 1) / (5 - 1) x 100. For example, the mean of CONF2 is 3.921, so the performance of CONF2 is (3.921 - 1) / 4 x 100 = 73.0.
Step 2. Rescale the outer weights so that they sum to 1 within each construct (rescaled outer weights). For CONFIRM: 0.246 + 0.276 + 0.204 + 0.274 = 1.000.
Step 3. Compute the performance of the construct = sum of (rescaled weight x item performance). For CONFIRM: 0.246 x 71.85 + 0.276 x 73.03 + 0.204 x 72.05 + 0.274 x 71.36 = 72.08.
3. Running IPMA in SmartPLS 4
Step 1. Open the model marketplace-x-model and choose Calculate > Importance-performance map analysis (IPMA).
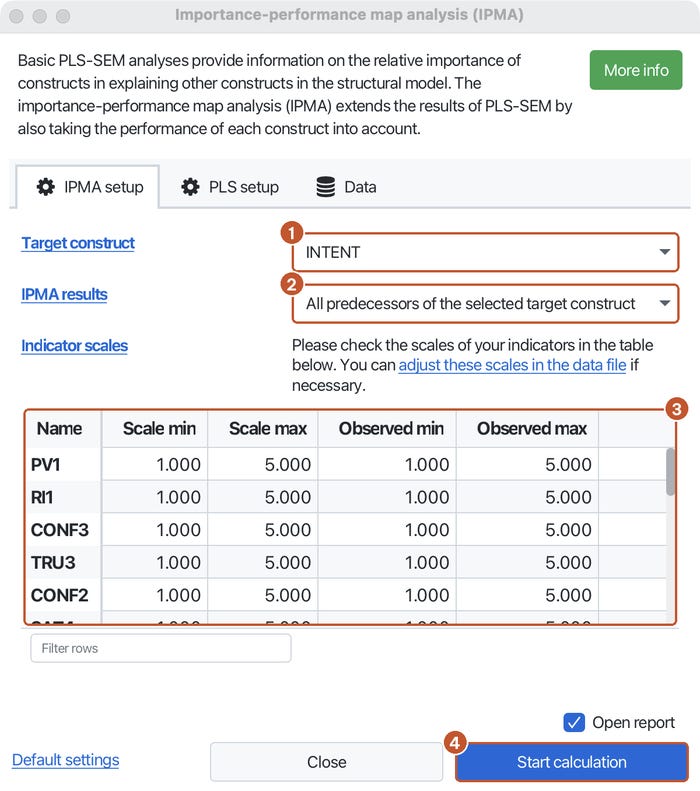
Step 2. On the IPMA setup tab (Figure 1):
Set Target construct to INTENT. Until a target is selected, the Start calculation button is disabled and the dialog shows "A target construct needs to be selected".
Keep IPMA results at All predecessors of the selected target construct, to get results for every construct that precedes INTENT.
Check the Indicator scales table: Scale min and Scale max are 1 and 5 for every item. If the actual scale differs from the observed minimum and maximum (for example, nobody chose 1), correct the scale with the link "adjust these scales in the data file".
Check that the Data tab is set to Casewise deletion, then click Start calculation.
4. Reading the construct-level results
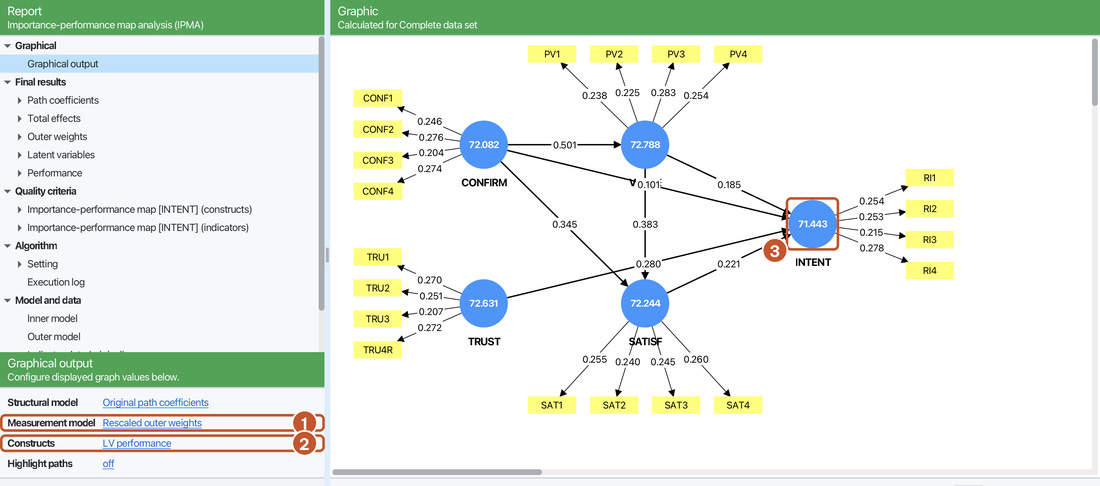
Step 3. The results graph (Figure 2) shows the performance inside each circle and the rescaled outer weight on each line to an item. The Graphical output panel at the bottom left shows what the graph is displaying (Rescaled outer weights, LV performance).
Step 4. Open Quality criteria > Importance-performance map [INTENT] (constructs) > Importance-performance map (Figure 3), then open Construct total effects for [INTENT] to read the numbers (Figure 4).
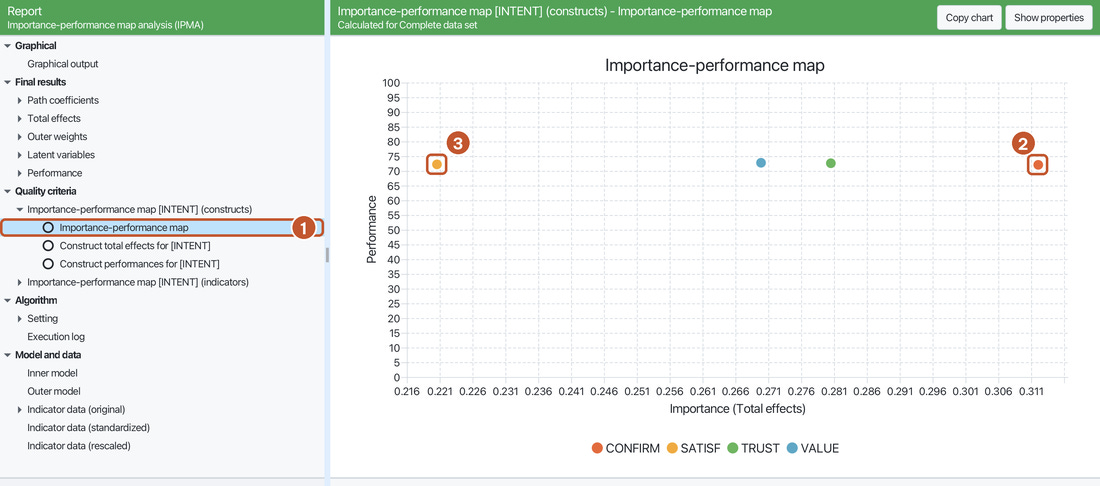

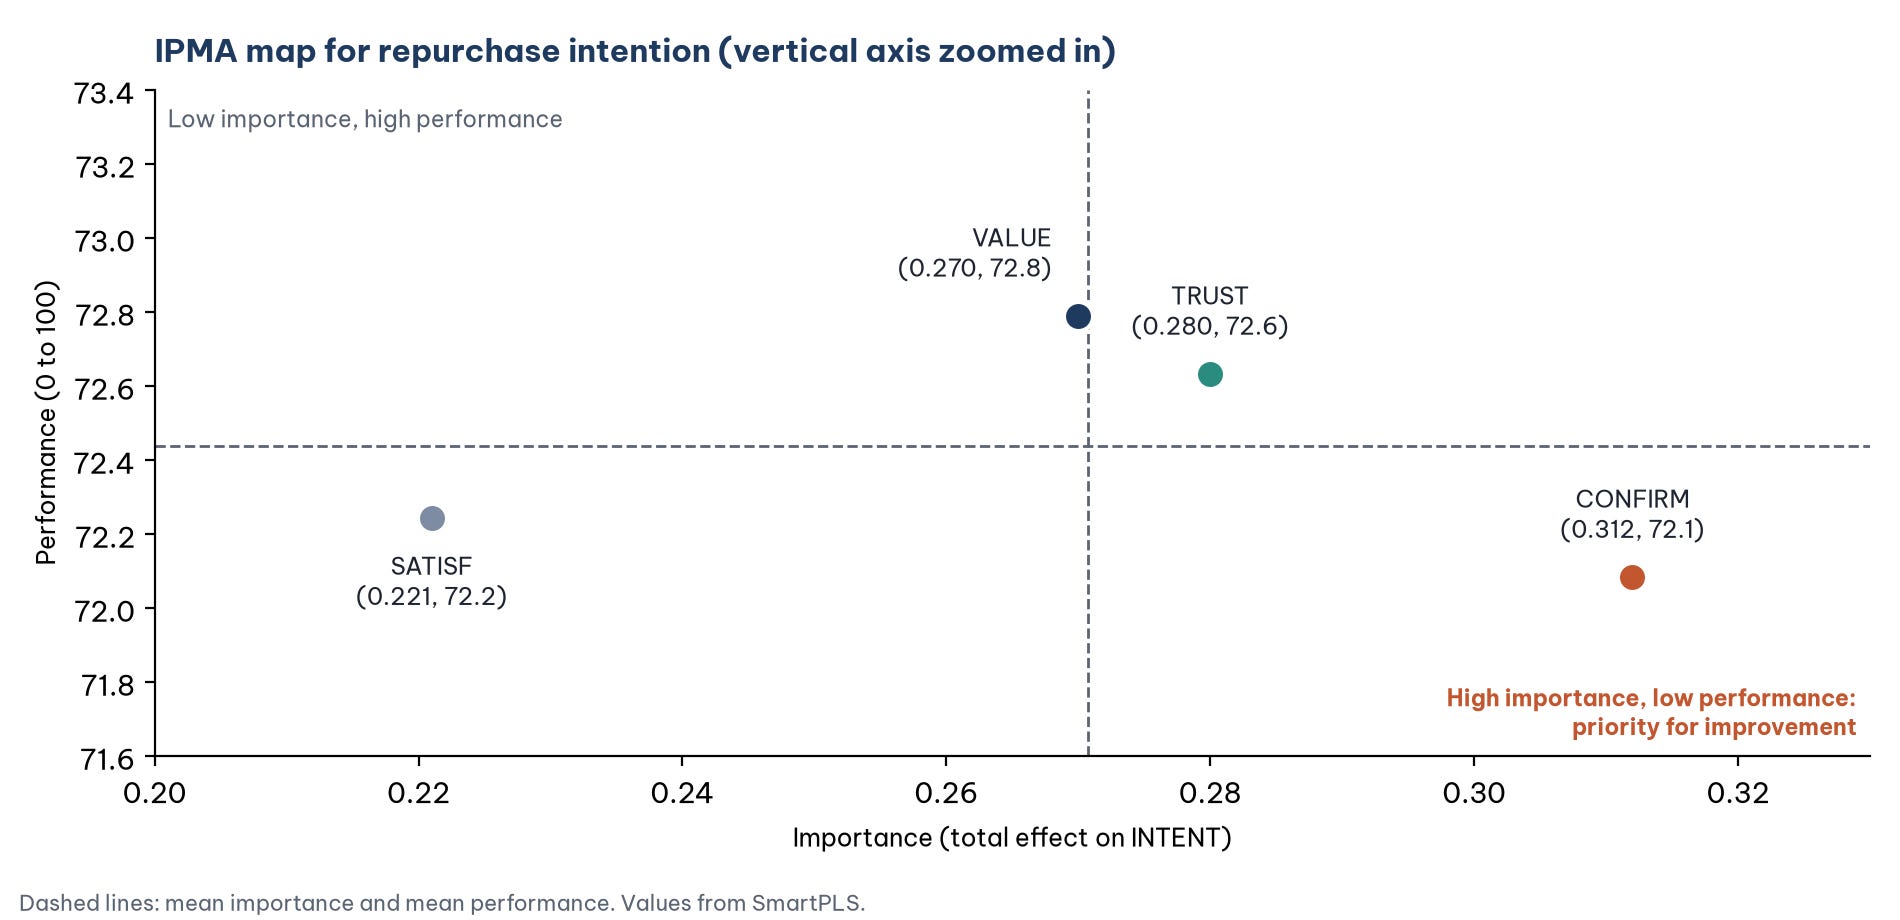
On the SmartPLS map the vertical axis runs from 0 to 100, so the four points lie almost on one horizontal line. Figure 5 zooms in on the vertical axis and adds two mean lines that divide the map into four zones.
Interpretation:
Confirmation of expectations is the factor to prioritize. It has the highest importance (0.312) and the lowest performance (72.08). Following Ringle and Sarstedt (2016), with an unstandardized total effect of 0.298 (see the note below), a 1-point increase in the performance of CONFIRM (on the 0 to 100 scale) goes with an increase of about 0.30 points in the performance of INTENT, more than any other factor.
The importance of CONFIRM is mostly indirect. The direct effect of CONFIRM on INTENT is not significant (Post 39), but the total effect also includes the part that runs through VALUE and SATISF (Post 40). So CONFIRM is not important in terms of its direct effect, but it is the most important in terms of its total effect.
The performance of the four factors is almost the same (72.08 to 72.79, a difference of less than 1 point on a 100-point scale). Such small differences should not be read as real differences; the priority order here comes mainly from importance.
SATISF has the lowest importance (0.221), because it only has a direct effect on INTENT.
Note on how importance is computed. SmartPLS 4.1.2.1 reports importance as the standardized total effect, which equals the Total effects table of Post 40 (CONFIRM 0.312; VALUE 0.270). Ringle and Sarstedt (2016) describe importance as the unstandardized total effect, computed on the 0 to 100 scores. Computed this way in R, it is 0.298 (CONFIRM), 0.257 (TRUST), 0.249 (VALUE) and 0.211 (SATISF), the same values as the
doIPMAfunction of cSEM. Both approaches give the same ranking. When reporting, state the software and the type of total effect used.
5. Reading the indicator-level results
Step 5. Open Importance-performance map [INTENT] (indicators) > Importance-performance map (Figure 6), then open Indicator total effects for [INTENT] (Figure 7).
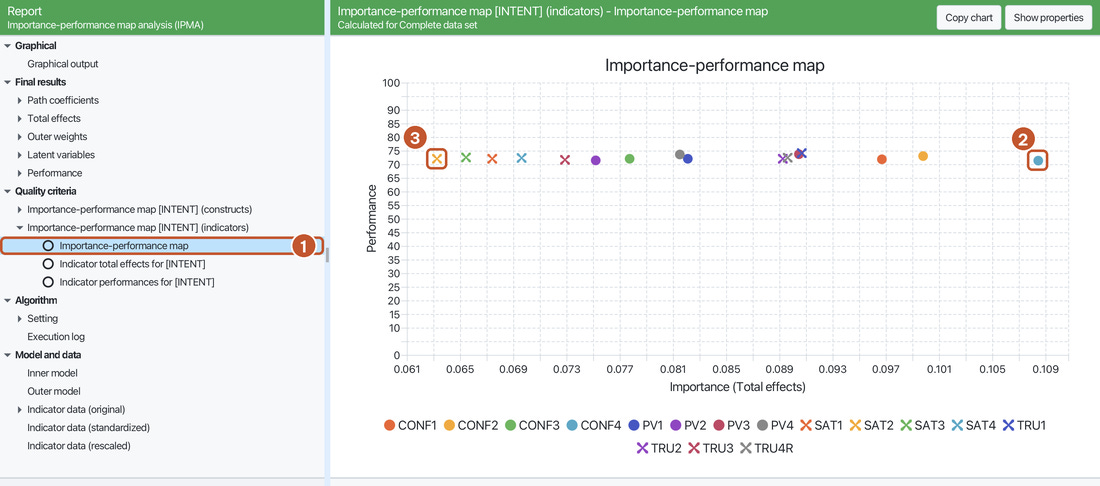
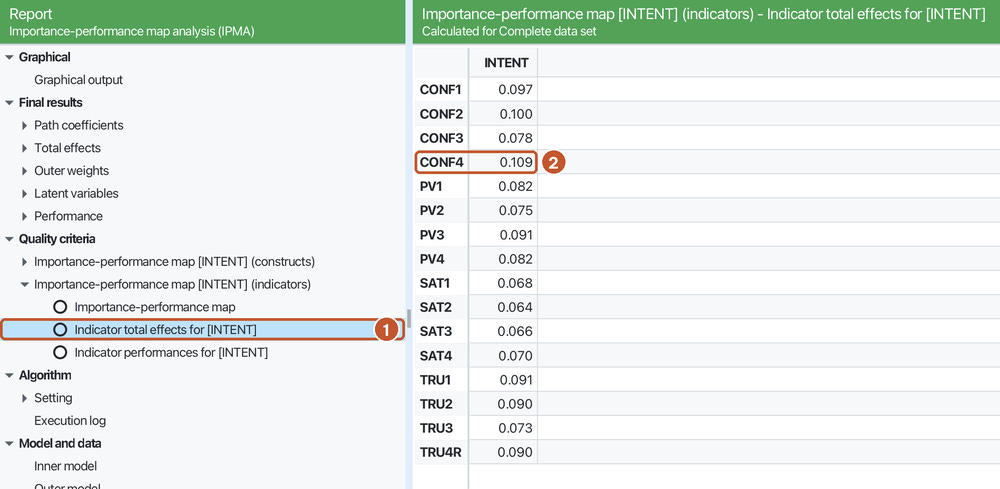
Importance of an item = standardized outer weight of the item x importance of its construct. The R cross-check matches SmartPLS for all 16 items, for example CONF4: 0.349 x 0.312 = 0.109.
CONF4 is the item to prioritize: it has the highest importance and the lowest performance of the four CONFIRM items. In a real study, the wording of this item tells you which specific aspect of the experience falls short of customers' expectations.
Part 2. Higher-order construct models
6. What is a higher-order construct?
A higher-order construct (HOC) is measured through lower-order constructs (LOCs) rather than directly by items. For example, "service quality" may consist of the dimensions reliability, responsiveness and empathy, each measured by a few items.
Sarstedt et al. (2019) distinguish four types, according to the measurement of the lower-order constructs (first term) and the relationship between the higher-order and lower-order constructs (second term):
Three estimation approaches are commonly used: repeated indicators (the HOC reuses all the items of its LOCs), embedded two-stage and disjoint two-stage (Becker et al., 2012; Sarstedt et al., 2019).
7. The illustrative model
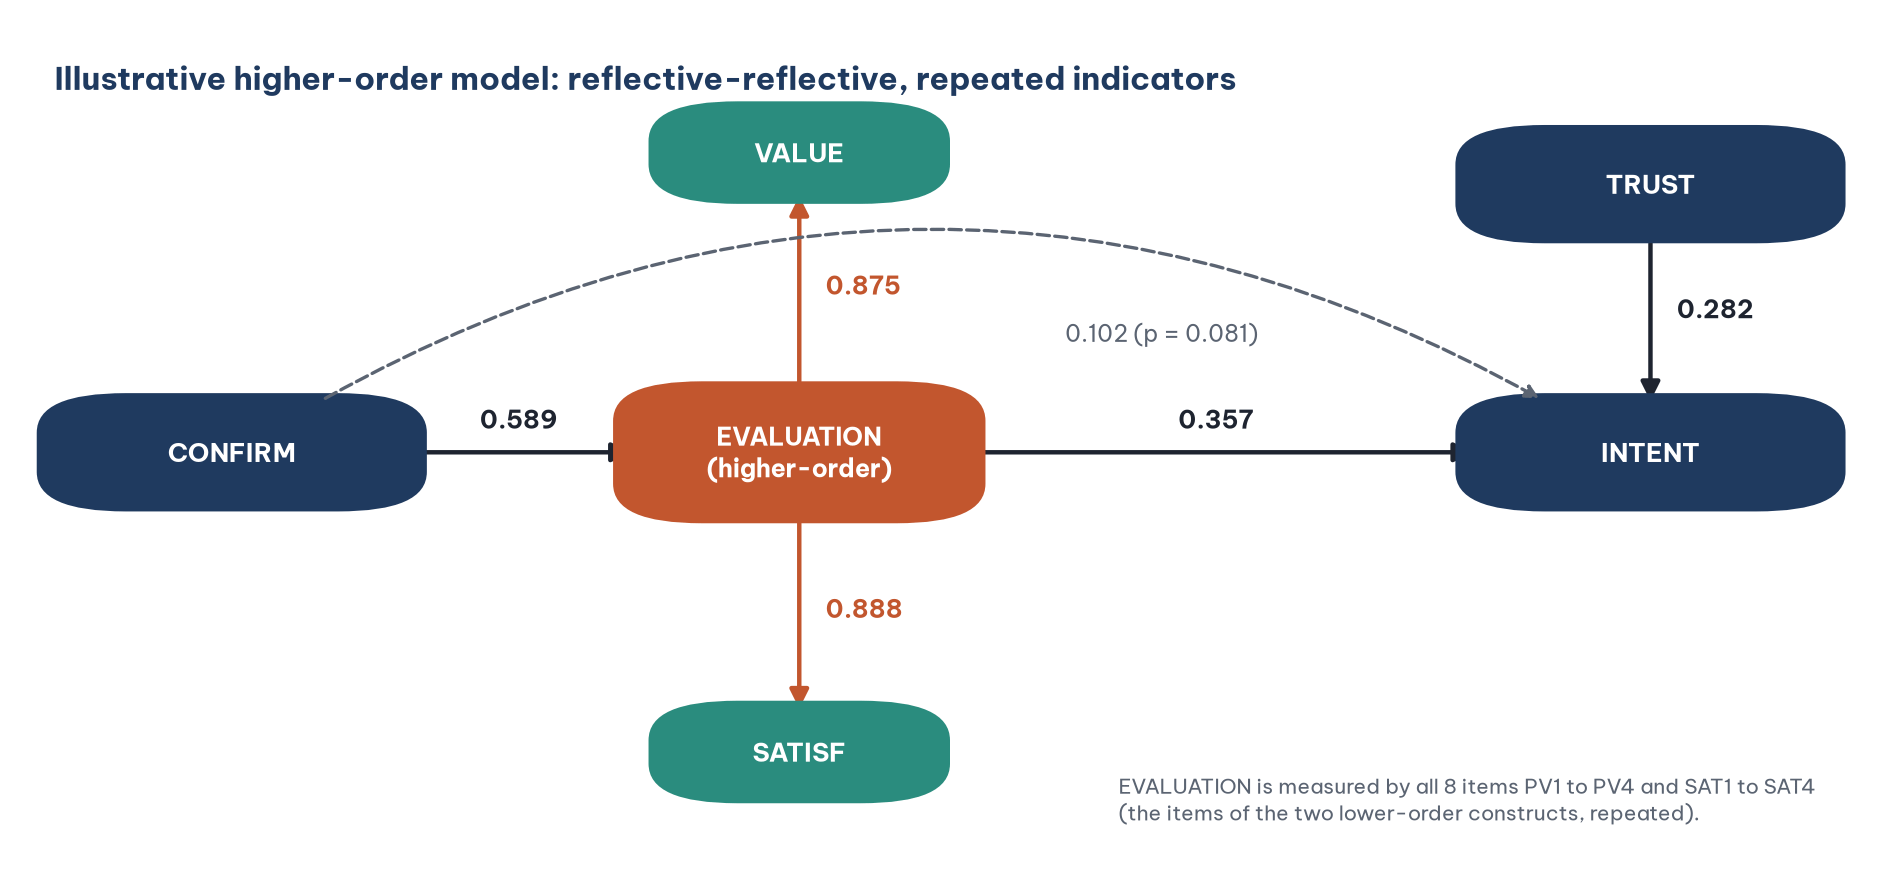
To illustrate the technique, this post builds a reflective-reflective higher-order construct EVALUATION (Post-purchase evaluation) with two lower-order constructs, VALUE and SATISF (Figure 8). The new structure: CONFIRM to EVALUATION to INTENT, keeping the two paths CONFIRM to INTENT and TRUST to INTENT.
This is a technical example, not the theoretical model of the series. The Marketplace X model treats VALUE and SATISF as two separate constructs with a causal relationship (H3). Merging them into one higher-order construct removes hypothesis H3. In a real study, a higher-order construct needs a theoretical basis established beforehand, and the lower-order constructs must be dimensions of the same general concept.
8. Building the higher-order model in SmartPLS 4
Step 6. Make a copy of marketplace-x-model, name it hcm-model and open the copy.
Step 7. Select the five paths CONFIRM to VALUE, CONFIRM to SATISF, VALUE to SATISF, VALUE to INTENT and SATISF to INTENT one by one, and click Delete to remove them.
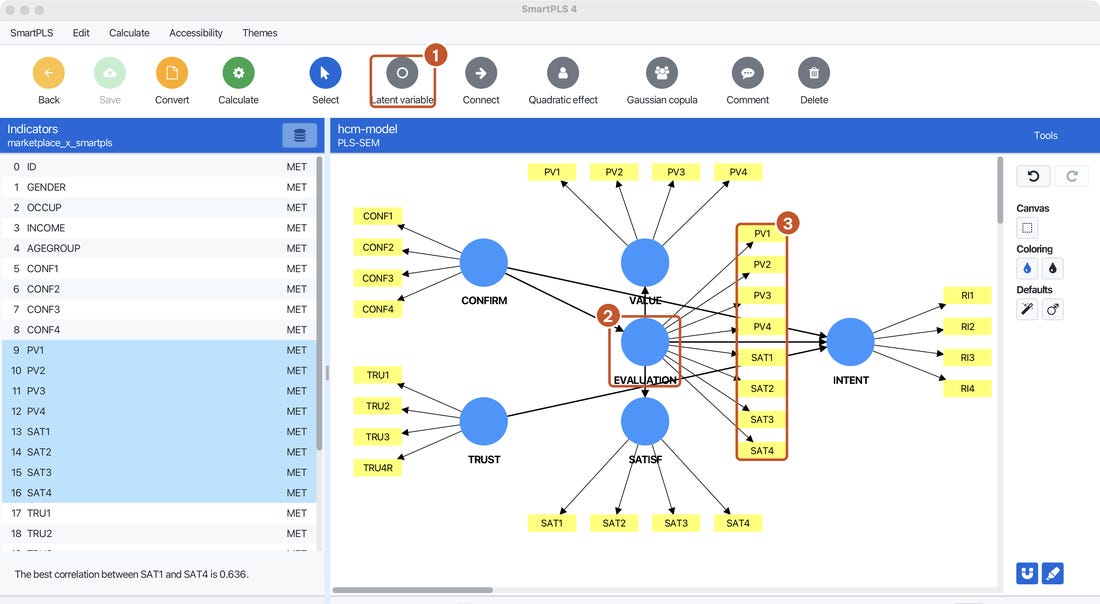
Step 8. Click the Latent variable button, click on the canvas to create a new construct and name it EVALUATION.
Step 9. Select the eight items PV1 to PV4 and SAT1 to SAT4 in the Indicators list and drag them onto EVALUATION. These items stay with VALUE and SATISF as well: this is the repeated indicators approach.
Step 10. Click Connect and draw four paths: EVALUATION to VALUE, EVALUATION to SATISF (reflective-reflective, so the arrows point from the higher-order construct to the lower-order constructs), CONFIRM to EVALUATION and EVALUATION to INTENT. Click Save (Figure 9).
Step 11. Choose Calculate > PLS-SEM algorithm (same settings as in the previous posts), click Start calculation, then open Final results > Path coefficients > Matrix (Figure 10).

9. Evaluating the higher-order construct
For the reflective-reflective type, the two coefficients EVALUATION to VALUE (0.875) and EVALUATION to SATISF (0.888) are read as the loadings of the higher-order construct (Sarstedt et al., 2019). Assess reliability and convergent validity as for the reflective scales in Post 34, but using these two "loadings":
AVE = (0.875² + 0.888²) / 2 = (0.766 + 0.789) / 2 = 0.778, above 0.50.
Composite reliability rho_c = (0.875 + 0.888)² / [(0.875 + 0.888)² + (1 - 0.766) + (1 - 0.789)] = 3.108 / 3.553 = 0.875, above 0.70.
The R² values of VALUE (0.766) and SATISF (0.789) in the report are simply the squares of these two coefficients, not the explanatory power of a causal model. Do not interpret them as ordinary R² values.
10. Testing the structural model
Step 12. Run Calculate > Bootstrapping with the settings of Post 39, then open Path coefficients > Mean, STDEV, T values, p values (Figure 11).

Interpretation:
Post-purchase evaluation has a strong effect on INTENT (0.357; p < 0.001), larger than the separate effects of VALUE (0.185) or SATISF (0.221) in the original model.
The R² of INTENT is still 0.318, the same as in the original model: merging the two constructs into one makes the model more parsimonious without reducing its explanatory power.
The direct effect of CONFIRM on INTENT is still not significant (p = 0.081), as in Post 39.
R (script higher_order.R) gives exactly the same coefficients; the standard errors and p values differ in the third decimal place because of the bootstrap samples (for example, CONFIRM to INTENT: p = 0.082).
When not to use repeated indicators? For the reflective-formative or formative-formative types, if the higher-order construct has a predecessor (like CONFIRM here), the repeated indicators approach pulls the coefficient from that predecessor to the higher-order construct toward zero, because the lower-order constructs already explain almost all of the variance of the higher-order construct. In that case, use a two-stage approach (Becker et al., 2012; Sarstedt et al., 2019).
11. Reporting the results
IPMA. The IPMA for the target construct repurchase intention shows that confirmation of expectations has the highest importance (total effect 0.312) but the lowest performance (72.08 on a 100-point scale), followed by trust (0.280; 72.63), perceived value (0.270; 72.79) and satisfaction (0.221; 72.24). Because the performance of the factors is almost the same, managerial priority should go to confirmation of expectations, especially item CONF4 (importance 0.109; performance 71.4).
Higher-order model. The higher-order construct post-purchase evaluation (reflective-reflective, estimated with repeated indicators; Sarstedt et al., 2019) has loadings on perceived value and satisfaction of 0.875 and 0.888 respectively (p < 0.001), AVE = 0.778 and composite reliability 0.875. Post-purchase evaluation has a positive effect on repurchase intention (coefficient = 0.357; t = 6.334; p < 0.001).
Five common mistakes
Running IPMA while reverse-worded items have not been recoded. Negative weights make the performance values wrong.
Reading the IPMA map without looking at the scale of the vertical axis. On a 0 to 100 map, the points can look identical; on a zoomed-in map, small differences look very large.
Concluding "priority for improvement" from direct effects only. IPMA uses total effects; a factor whose direct effect is not significant can still be the most important (CONFIRM in this post).
Building a higher-order construct without a theoretical basis, just to make the model more parsimonious or to avoid discriminant validity problems between the lower-order constructs.
Interpreting the R² of the lower-order constructs in a repeated indicators model as explanatory power.
Frequently asked questions
Does the IPMA target construct have to be the final construct of the model?
No, but you usually choose the outcome that matters most for management (repurchase intention here). You can run IPMA for several different target constructs.
Is a performance of 72 high or low?
IPMA has no general threshold. Performance is meaningful when compared across factors, across customer groups or across survey waves.
Does a higher-order construct need a discriminant validity assessment?
Yes. Discriminant validity is assessed between the higher-order construct and the other constructs in the model (here CONFIRM, TRUST and INTENT), not between the higher-order construct and its own lower-order constructs (Sarstedt et al., 2019).
What does the repeated indicators approach require?
The lower-order constructs should have roughly the same number of items; otherwise the lower-order construct with more items dominates the higher-order construct (Becker et al., 2012). In this post, VALUE and SATISF both have four items.
This brings the 42-post series to a close: from research design and data cleaning in SPSS, through CFA and CB-SEM in JASP, to PLS-SEM in SmartPLS. Each post comes with data, scripts and screenshots so that readers can rerun the analyses and check every number.
References
Becker, J.-M., Klein, K., & Wetzels, M. (2012). Hierarchical latent variable models in PLS-SEM: Guidelines for using reflective-formative type models. Long Range Planning, 45(5–6), 359–394. https://doi.org/10.1016/j.lrp.2012.10.001
Hair, J. F., Hult, G. T. M., Ringle, C. M., & Sarstedt, M. (2022). A primer on partial least squares structural equation modeling (PLS-SEM) (3rd ed.). SAGE Publications.
Ringle, C. M., & Sarstedt, M. (2016). Gain more insight from your PLS-SEM results: The importance-performance map analysis. Industrial Management & Data Systems, 116(9), 1865–1886. https://doi.org/10.1108/IMDS-10-2015-0449
Ringle, C. M., Wende, S., & Becker, J.-M. (2026). SmartPLS 4 (Version 4.1.2.1) [Computer software]. SmartPLS GmbH. https://www.smartpls.com
Sarstedt, M., Hair, J. F., Cheah, J.-H., Becker, J.-M., & Ringle, C. M. (2019). How to specify, estimate, and validate higher-order constructs in PLS-SEM. Australasian Marketing Journal, 27(3), 197–211. https://doi.org/10.1016/j.ausmj.2019.05.003
Discussion about this post