Composite Reliability (CR) and AVE in JASP: Compute and Read Them
Get composite reliability and average variance extracted directly in free JASP, check them by hand and report honestly when AVE falls below 0.5


Key takeaways
CR uses the loadings estimated in the CFA, so items may contribute unequally; Cronbach's alpha assumes equal loadings.
In JASP, tick Average variance extracted (AVE) and Reliability; the Coefficient omega column is the CR.
Compute CR and AVE only from fully standardized loadings, never from unstandardized ones.
The five scales have CR from 0.785 to 0.844; four have AVE from 0.538 to 0.575.
Repurchase intention has AVE = 0.477; dropping RI3 raises it only to 0.488 and removes content, so the scale is kept and the limitation reported.
Post 22, "Confirmatory Factor Analysis (CFA) in JASP" gave us the standardized loadings of the 20 items, and Post 23, "SEM Model Fit Indices in JASP" showed that the measurement model fits the data. Two questions remain before we can conclude that the scales are adequate: is each scale reliable, and do its items converge on a common construct? The two indices that answer them are composite reliability (CR) and average variance extracted (AVE) (Fornell & Larcker, 1981).
The sample data raise one point for discussion: the AVE of the Repurchase intention scale is 0.477, below the commonly used threshold of 0.5. This post keeps that result as it is and shows how to handle and report it honestly.
Sample data and scripts. The data files and scripts for this post are in the research-data-analysis repository on GitHub (folder
data/andscripts/; the Excel template is indata/). Download the whole repository with Code > Download ZIP.
About the figures and numbers. The screenshots are from JASP 0.99.0 (JASP Team, 2026) on macOS, continuing the CFA of Post 22 on the data file
marketplace_x_sem.sav. The result tables come from JASP's Export Results. The numbers were checked in R with the lavaan (Rosseel, 2012) and semTools (Jorgensen et al., 2022) packages (scriptcr_ave.R) and with the Excel filecr_ave_template.xlsx, both in the repository. AMOS does not print CR or AVE: copy the Estimate column of View > Text Output > Estimates > Scalars > Standardized Regression Weights into column C of the CR_AVE sheet of the same Excel file, which then computes CR, AVE and the square root of AVE by formula.
1. How does CR differ from Cronbach's alpha?
Post 11, "Cronbach's Alpha in PSPP (SPSS)" used Cronbach's alpha (Cronbach, 1951) to measure reliability. Alpha assumes that every item contributes equally to the scale (equal loadings, known as tau equivalence). When the loadings differ a lot, alpha usually underestimates the true reliability (McNeish, 2018).
CR (also called coefficient omega when it is computed for a one-factor model) uses the loadings estimated in the CFA itself, so each item may contribute differently (Raykov, 1997). Once you have run a CFA, CR is therefore the more appropriate reliability index to report.
2. Formulas
For a scale with k items, let L be the standardized loading of each item (Fornell & Larcker, 1981):
CR = (Sum of L)² / [(Sum of L)² + Sum of (1 − L²)]
AVE = Sum of L² / k
Here 1 − L² is the standardized error variance of the item, and L² is the R² of the item (Post 22). AVE is the mean R² of the items: the average share of item variance that the construct explains, compared with the share due to measurement error.
Use only fully standardized loadings (the Standardized Regression Weights table in AMOS, the Std. estimate column with Standardization = All in JASP). Using unstandardized coefficients by mistake gives wrong CR and AVE values, sometimes above 1.
Hand calculation for the Repurchase intention scale
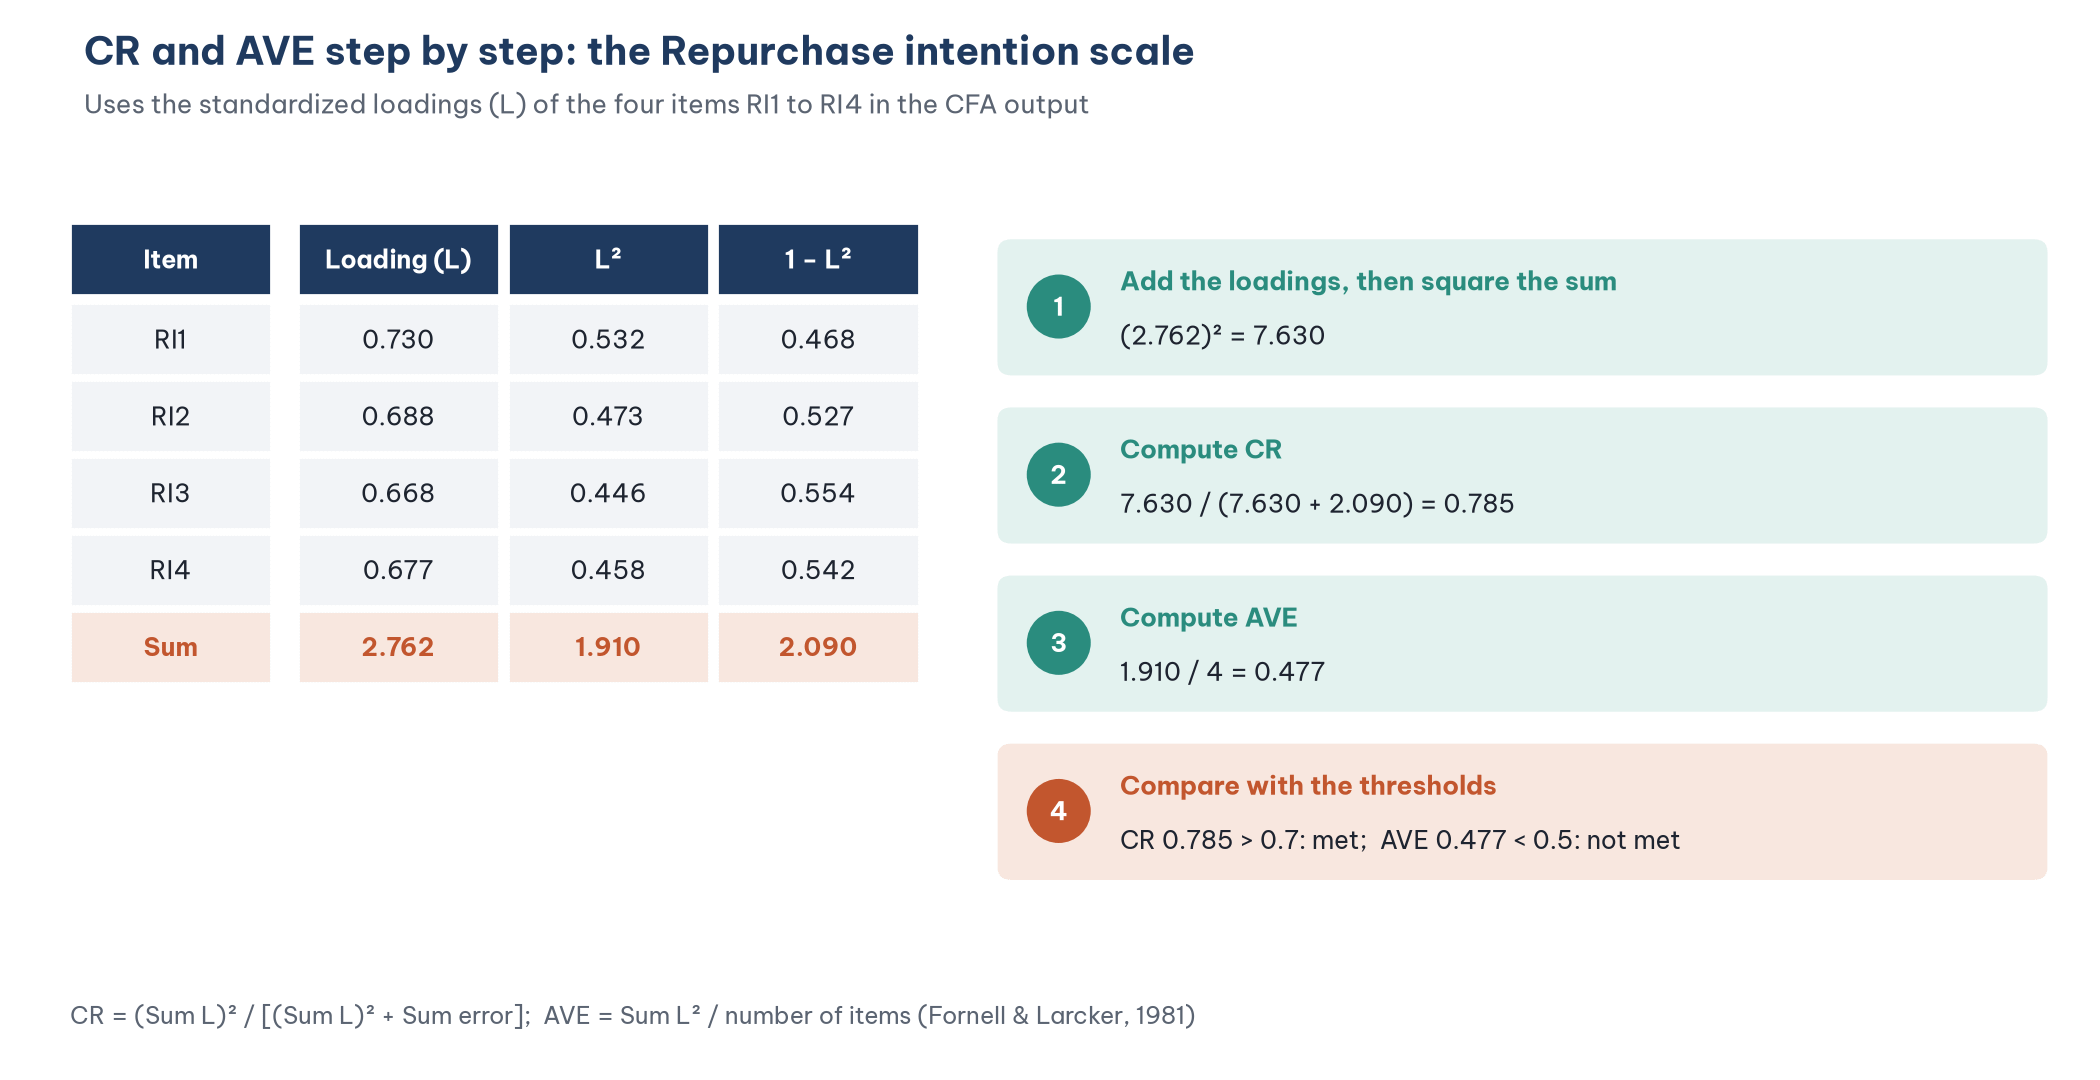
Add the four loadings: 0.730 + 0.688 + 0.668 + 0.677 = 2.762; squared, this gives 7.630.
Add the four error variances (1 − L²): 2.090.
Compute CR = 7.630 / (7.630 + 2.090) = 0.785.
Compute AVE = (0.532 + 0.473 + 0.446 + 0.458) / 4 = 1.910 / 4 = 0.477.
3. Getting CR and AVE in JASP
JASP computes both indices in the CFA module:
Open the CFA of Post 22 (five factors, data file
marketplace_x_sem.sav, ML with FIML).Tick Average variance extracted (AVE) and Reliability in the Additional Output section (Figure 2).
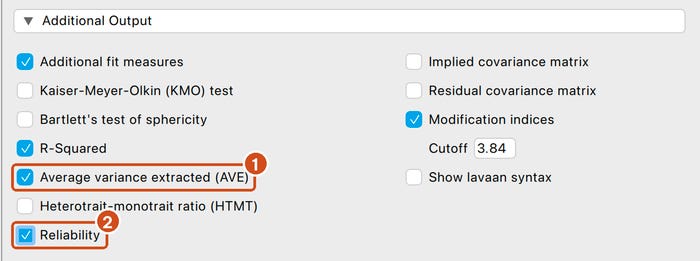
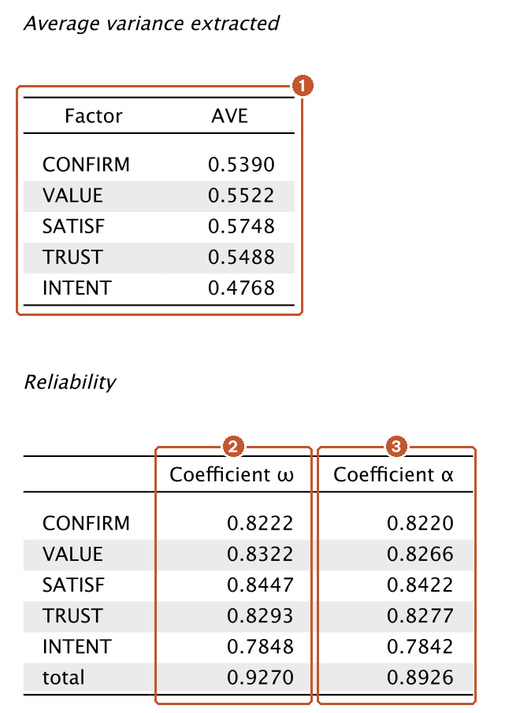
Four points to note when reading the output:
The Coefficient omega column is the CR. The JASP value for INTENT (0.7848) equals the hand-calculated CR (0.785).
JASP's AVE and omega can differ from the hand formula in the third decimal. For example, JASP prints AVE = 0.5390 and omega = 0.8222 for CONFIRM, while the formula gives 0.538 and 0.823. JASP's values equal those of semTools (
AVE()andcompRelSEM()incr_ave.R: 0.539 and 0.822), which compute the two indices in a slightly different way from the Fornell and Larcker formulas. For INTENT, JASP's AVE is 0.4768, which also rounds to 0.477. The conclusions are the same either way.The Coefficient alpha column is computed from the covariance matrix estimated by FIML on all 267 respondents, so it can differ in the third decimal from the alpha in PSPP in Post 11 (computed on the respondents who answered every item of the scale). For example, CONFIRM: 0.822 in JASP and 0.824 in PSPP.
The total row is the reliability when all 20 items are treated as one scale. Do not use this row for a multi-factor model.
To check the results or to show the calculation in a thesis, use the Excel file cr_ave_template.xlsx (folder data/ of the repository): paste the Std. estimate column of the Factor loadings table into column C.
4. Results for the five scales
Reading CR
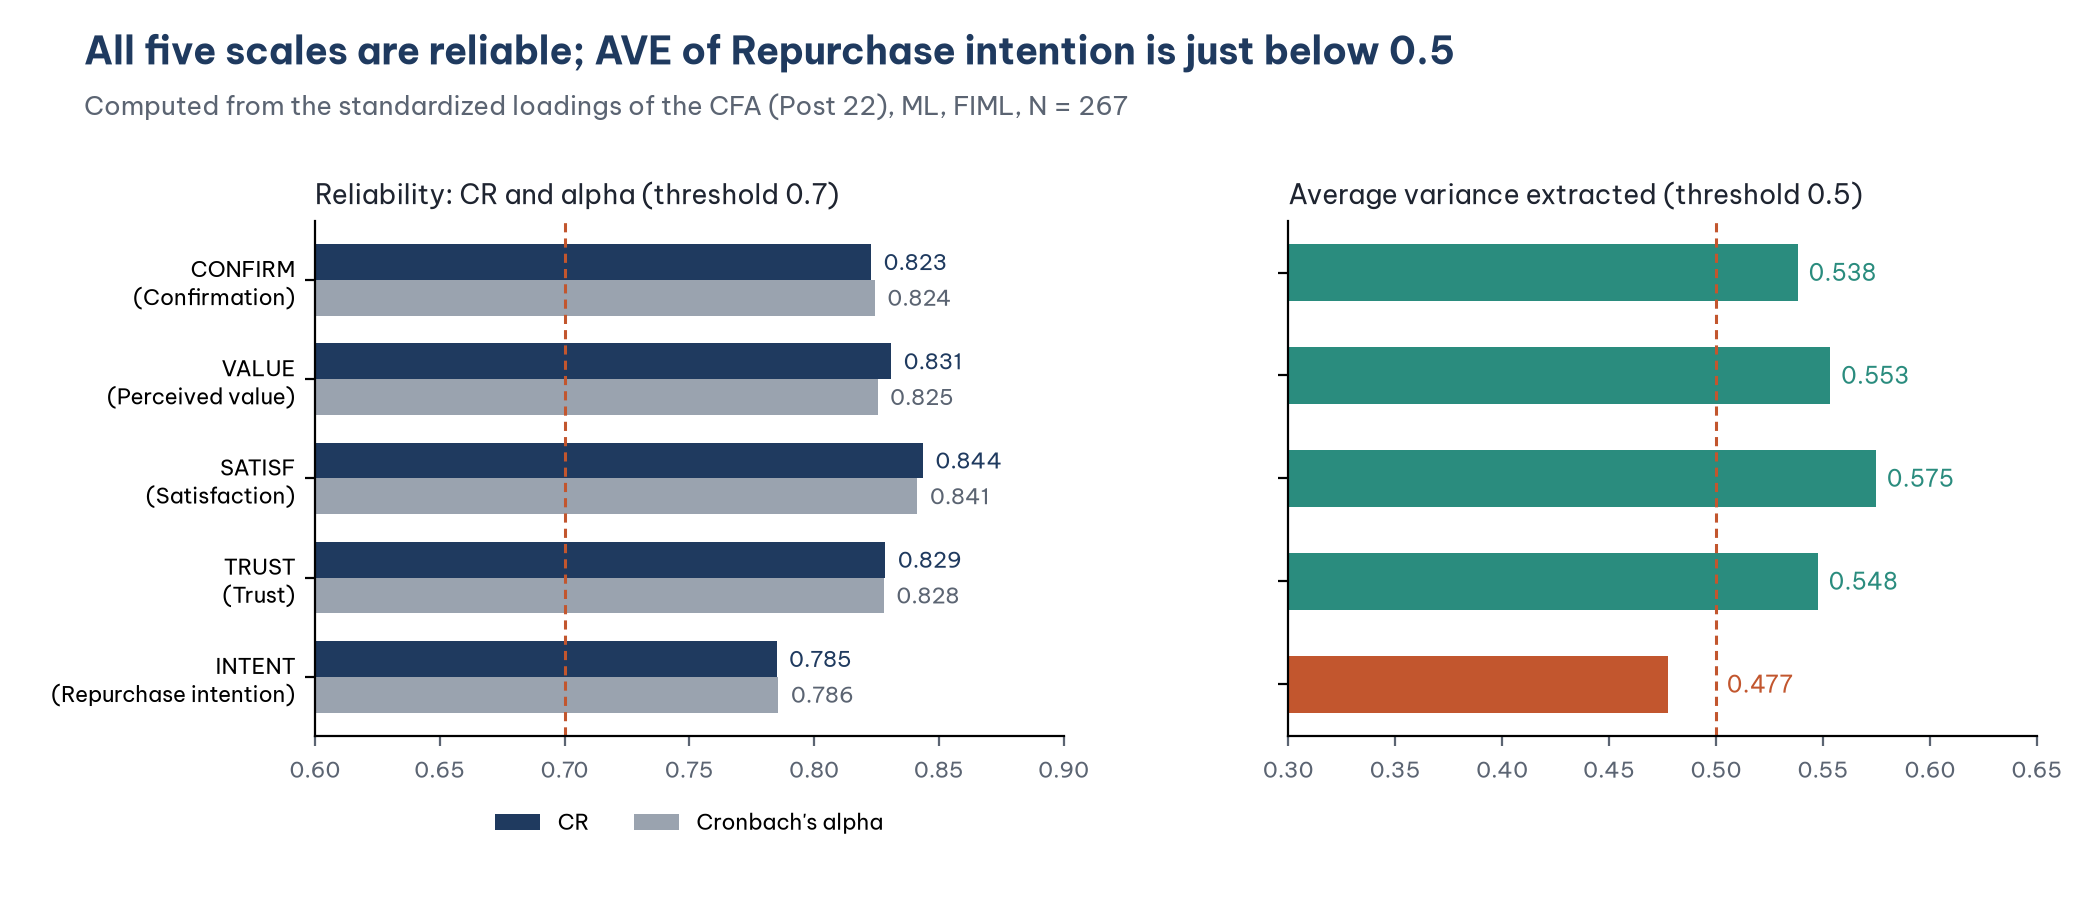
The usual threshold is CR of at least 0.7 (Hair et al., 2019); 0.6 can be accepted in exploratory research. A very high CR (above 0.95), on the other hand, suggests that the items almost repeat one another. The five scales have CR from 0.785 to 0.844: all met.
CR and alpha are almost identical for all five scales. The reason is that within each scale the loadings are fairly even (a maximum spread of about 0.2), so the tau-equivalence assumption of alpha roughly holds. When the loadings differ more, CR will be clearly higher than alpha.
Reading AVE
The usual threshold is AVE of at least 0.5 (Fornell & Larcker, 1981): the construct explains at least half of the variance of its items, and the rest is measurement error. Four scales meet it (0.538 to 0.575). The Repurchase intention scale has AVE = 0.477, which does not.
5. What to do when AVE is below 0.5
Look for the cause
AVE is the mean R² of the items. For INTENT, all four loadings lie between 0.67 and 0.73: no single item "drags" AVE down sharply; all four items are just moderate. The item R² values range from 0.45 to 0.53.
Try dropping the item with the lowest loading
Dropping the item with the lowest loading is a common way to raise AVE. With the sample data, the file cr_ave.R shows:
Dropping RI3 raises AVE only to 0.488, still below 0.5, while CR falls and the scale loses the item "I am likely to buy again on marketplace X in the next 3 months", a content aspect (a specific time frame) that the other items do not cover. Dropping one more item would leave two items, which is not enough to identify the scale on its own (Post 20, "Your First Model in JASP"). So no item should be dropped.
A reasonable choice: keep the scale and report honestly
Three grounds for keeping the Repurchase intention scale:
CR is met (0.785 > 0.7), and all loadings are significant and above 0.6.
Fornell and Larcker (1981) note that AVE is a more conservative measure than CR, and that on the basis of CR alone a researcher may conclude that convergent validity is adequate even though more than 50% of the variance is due to error. Many studies rely on this remark to accept AVE below 0.5 when CR is 0.6 or higher. This argument is widely used but not every committee or journal accepts it, so it must be stated clearly.
The scale has a theoretical basis and has been used in earlier studies (Post 3, "Levels of Measurement in Research").
What not to do: report only CR and hide AVE; or keep dropping items until AVE exceeds 0.5 without considering their content.
AVE is also used to assess discriminant validity (Post 25): the square root of the AVE of INTENT (0.691) is still larger than its highest correlation with the other factors (0.53 with SATISF, Post 22).
6. Reporting the results
The composite reliability of the five scales ranged from 0.785 to 0.844, above the 0.7 threshold (Hair et al., 2019), and close to Cronbach's alpha (0.786 to 0.841). The average variance extracted of four scales ranged from 0.538 to 0.575, meeting the 0.5 threshold (Fornell & Larcker, 1981). The Repurchase intention scale had an AVE of 0.477, below the threshold; however, its CR was 0.785 and all standardized loadings ranged from 0.67 to 0.73 (p < 0.001). Dropping the item with the lowest loading (RI3) raised AVE only to 0.488 and removed a content aspect, so the scale was kept with four items. This is a limitation of the convergent validity of the Repurchase intention scale.
The table should combine the loadings, CR, AVE and alpha of each scale, as in the table in section 4.
Five common mistakes
Using unstandardized loadings to compute CR and AVE.
Computing AVE from the sum of loadings instead of the sum of squared loadings.
Reporting only the indices that meet the threshold and leaving out those that do not.
Dropping items only to raise AVE without considering their content and the actual gain.
Using the CR of all 20 items (the total row in JASP) as the reliability of a multi-factor model.
Frequently asked questions
I already reported Cronbach's alpha in the PSPP step. Do I need to report CR too?
Report both: alpha because many committees are used to it, CR because it is more appropriate once you have run a CFA. In this model the two indices are almost equal.
Are CR and omega the same thing?
For a model with one factor per scale and uncorrelated errors, CR by the Fornell and Larcker formula and coefficient omega give very similar results. JASP calls this index Coefficient omega; semTools calls it compRelSEM. On the sample data, the three approaches agree to two decimal places.
Does an AVE below 0.5 spoil the whole model?
No. A low AVE is a limitation of one scale that must be reported and discussed. The next steps (discriminant validity, structural model) can still go ahead; path coefficients involving INTENT should be interpreted more cautiously.
Do I need CR and AVE for the structural model?
No. CR and AVE belong to the measurement model. When you move to the structural model (Post 26, "Structural Equation Model (SEM) in JASP"), the loadings usually stay almost the same, so use CR and AVE from the CFA.
References
Cronbach, L. J. (1951). Coefficient alpha and the internal structure of tests. Psychometrika, 16(3), 297–334. https://doi.org/10.1007/BF02310555
Fornell, C., & Larcker, D. F. (1981). Evaluating structural equation models with unobservable variables and measurement error. Journal of Marketing Research, 18(1), 39–50. https://doi.org/10.2307/3151312
Hair, J. F., Black, W. C., Babin, B. J., & Anderson, R. E. (2019). Multivariate data analysis (8th ed.). Cengage Learning.
JASP Team. (2026). JASP (Version 0.99.0) [Computer software]. https://jasp-stats.org/
Jorgensen, T. D., Pornprasertmanit, S., Schoemann, A. M., & Rosseel, Y. (2022). semTools: Useful tools for structural equation modeling (Version 0.5-6) [Computer software]. https://CRAN.R-project.org/package=semTools
McNeish, D. (2018). Thanks coefficient alpha, we'll take it from here. Psychological Methods, 23(3), 412–433. https://doi.org/10.1037/met0000144
Raykov, T. (1997). Estimation of composite reliability for congeneric measures. Applied Psychological Measurement, 21(2), 173–184. https://doi.org/10.1177/01466216970212006
Rosseel, Y. (2012). lavaan: An R package for structural equation modeling. Journal of Statistical Software, 48(2), 1–36. https://doi.org/10.18637/jss.v048.i02
Discussion about this post