Who Does What in a Business Analytics Cycle
A swimlane view of how a business question passes from hand to hand, what it turns into, and which decision it finally ends in


Key takeaways
Eight data job titles stop being confusing once you place them in one cycle: question, data, evidence, recommendation, action.
The SOAR model (specify, obtain, analyze, report) forms the backbone. Only the business analyst's lane is present at all four steps.
The report is not the end. The cycle branches into "not enough grounds", "management decision" or "system change", and loops back three ways.
The business analyst and the IT business analyst are different jobs that share the label "BA". So are the business analyst and the data analyst: one delivers answers, the other recommendations with trade-offs.
As AI makes evidence cheaper, value shifts to the two ends of the cycle: asking the right question and owning the decision.
If you have ever read job ads in the data field, you have probably seen this: eight different titles, overlapping job descriptions, and no one saying in what order these people work together. Business analyst, data analyst, BI analyst, data scientist, data engineer, data steward, ML engineer, IT business analyst: each title sounds familiar, but side by side they make it hard to answer the simplest question of all. Who starts, who finishes, and who hands what to whom?
Worse, in many job markets two different professions share the abbreviation "BA". Plenty of students who study business analytics look up the title "business analyst", find a purely IT job description, and conclude they chose the wrong degree. The confusion does more than unsettle career choices; it leads companies to hire the wrong people, assign the wrong work and expect the wrong results from an analytics project.
This article tackles the problem with one diagram. The diagram does not rank who is better, nor does it list required skills. It describes one analytics cycle from start to finish: where the business question appears, whose hands it passes through, what it turns into, and where it ends. Section 1 introduces the diagram and how to read it. Section 2 walks through the five lanes. Sections 3 and 4 analyse what happens after the report: three decision branches and three feedback loops. Section 5 clears up the four most common confusions. Section 6 discusses the work artificial intelligence is taking on, Section 7 looks at an AI agent that runs the whole SOAR cycle on its own, and Section 8 suggests how to use the diagram as an organizational diagnostic.
1. The swimlane diagram and how to read it
An analytics cycle involves many people, many steps and many hand-offs. The most compact way to see them all on one page is a swimlane diagram, a familiar tool in process analysis. This section introduces the diagram, the four-step framework that forms its vertical axis, and the conventions you need before reading the details.
1.1. The whole cycle at a glance
Figure 1 presents the entire business analytics cycle as a swimlane diagram, from the moment a business problem is raised until it becomes a decision or a system change.
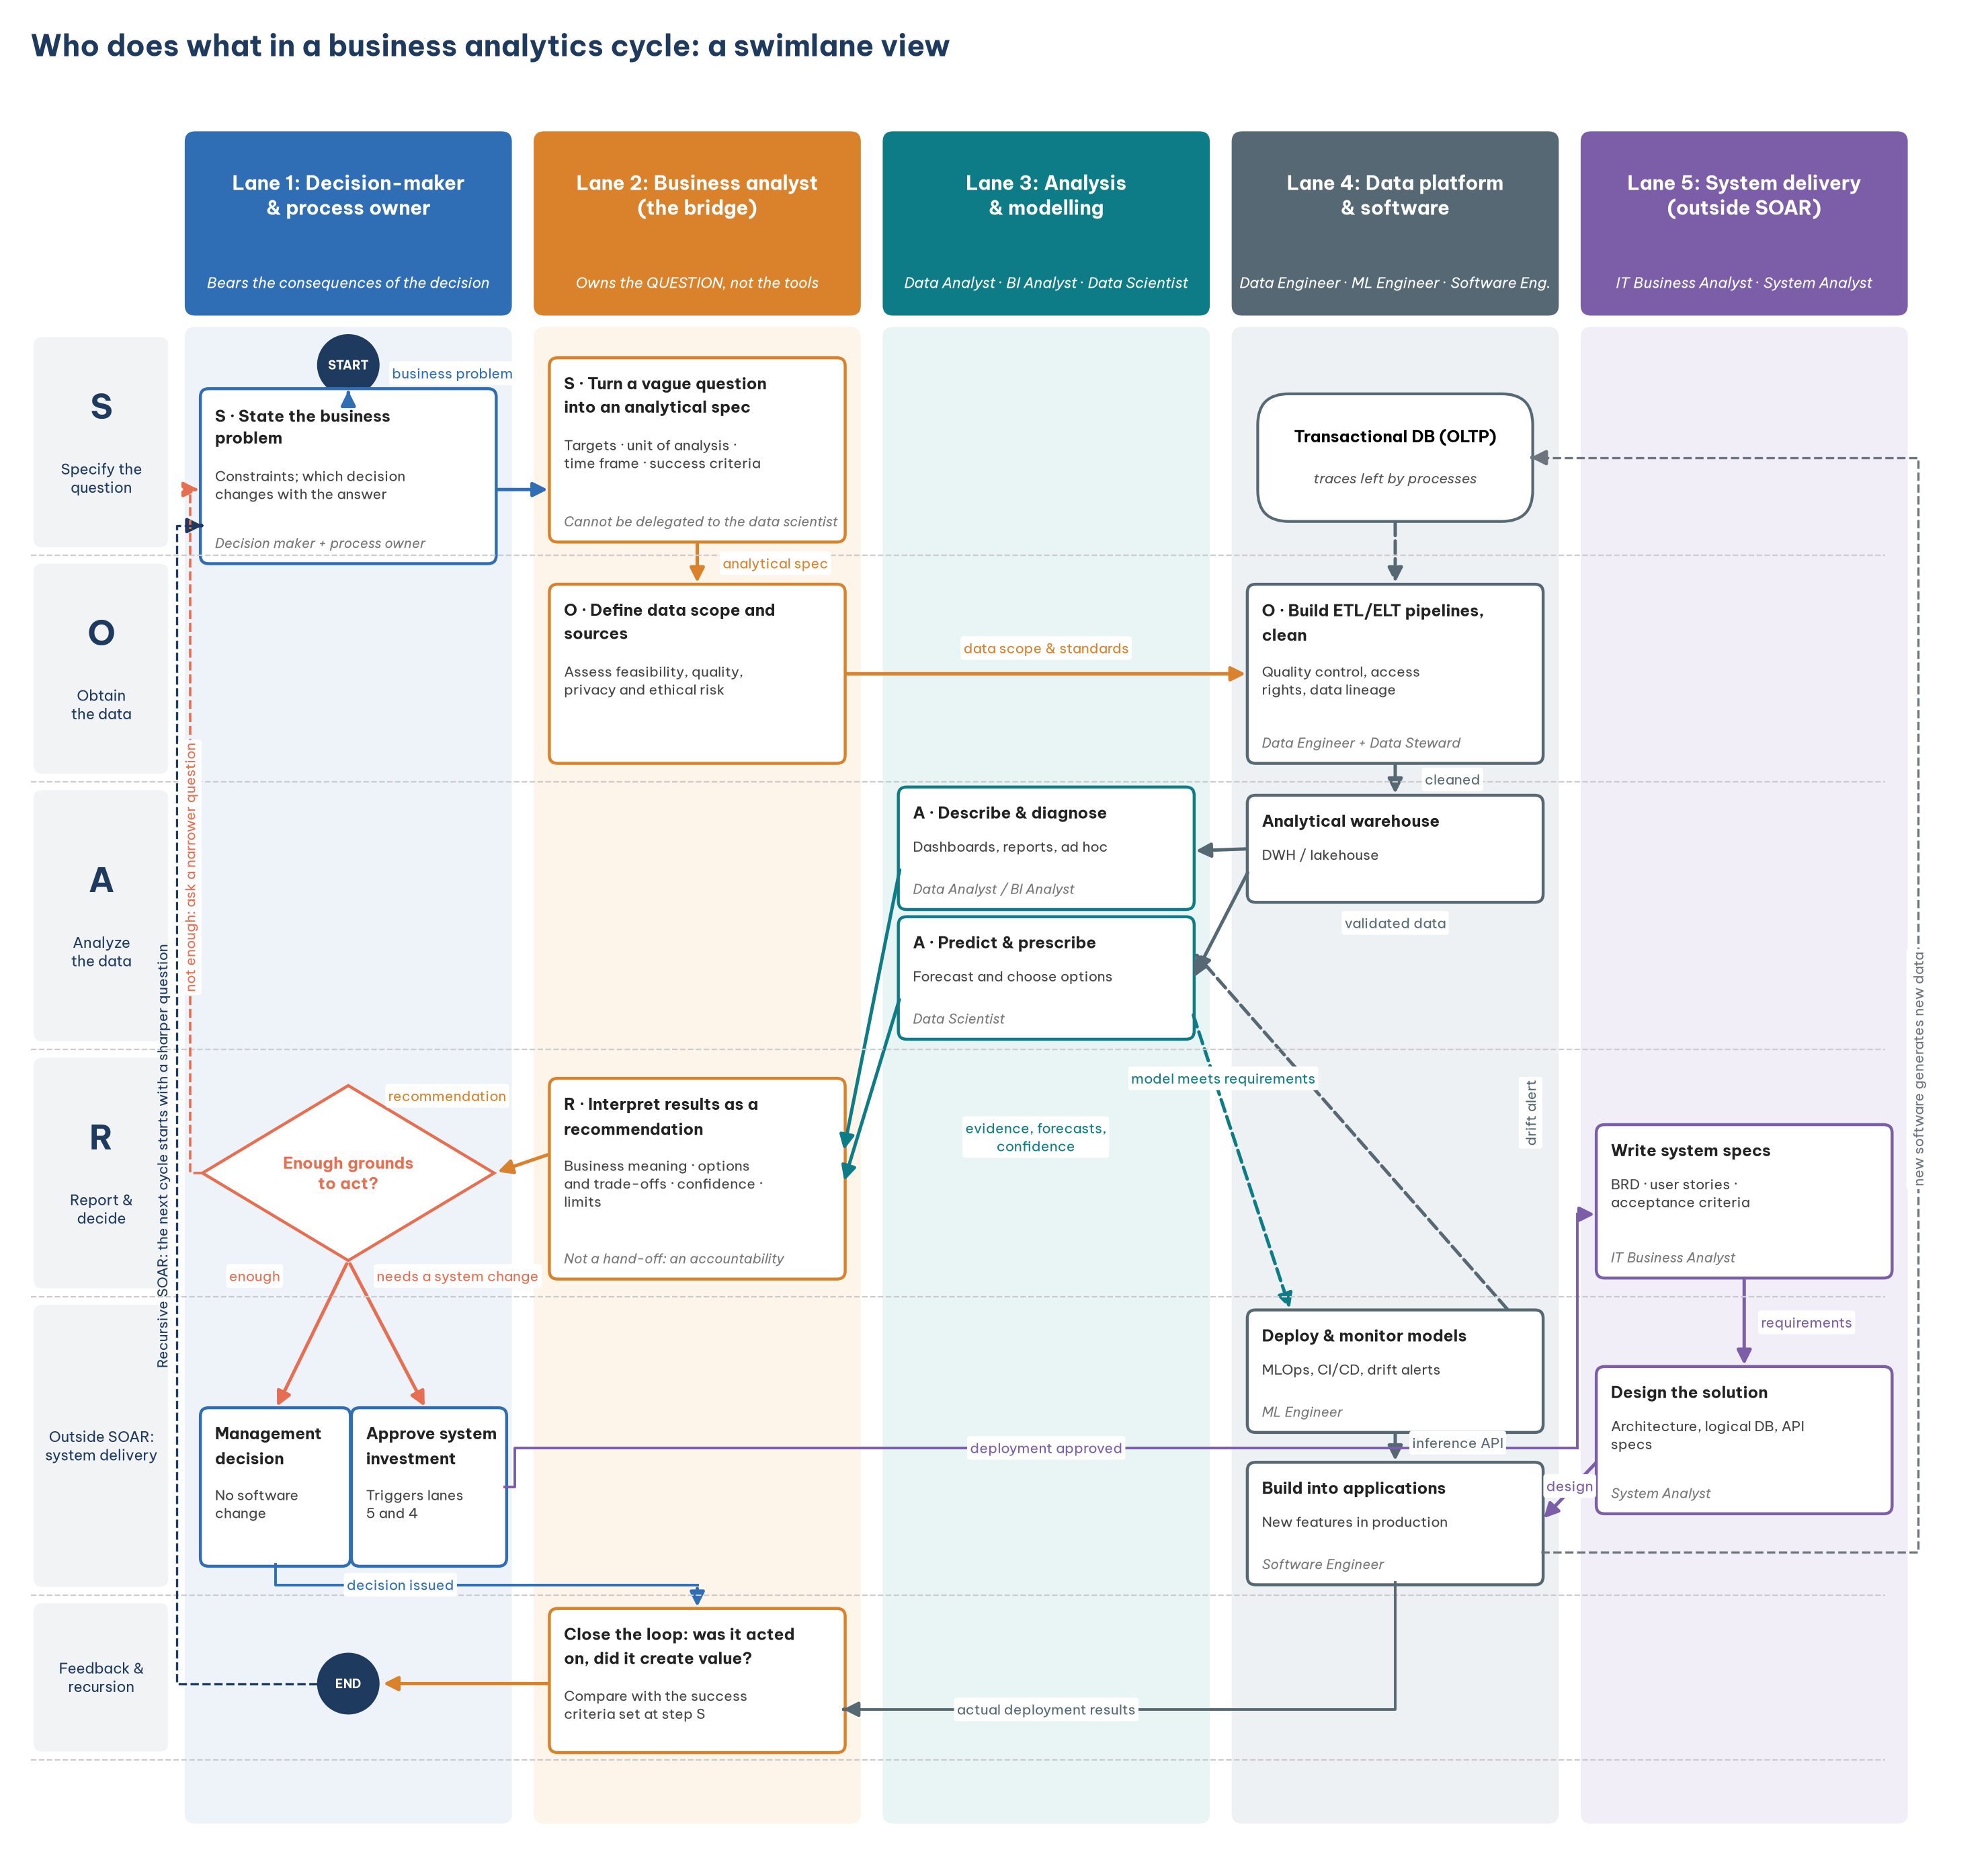
If you remember only one sentence from Figure 1, make it this one: the question travels from left to right to become data and evidence, then travels back to the left to become a decision; the person standing between the outbound and return journeys is the business analyst. Every detail in the following sections is a way of unpacking that sentence.
1.2. The two axes of the diagram
The diagram has two axes. The columns are role lanes: each lane groups roles with the same kind of responsibility, and whichever lane a box sits in, that lane's role is responsible for doing it. The horizontal bands are steps in the cycle: the first four bands correspond to the four steps of the SOAR model, and the last two lie outside SOAR. So a box's position immediately tells you two things: who does it, and at which stage.
SOAR is the analytical thinking framework Richardson and Watson use throughout their textbook Introduction to Business Analytics. It has four steps: specify the question, obtain the data, analyze the data and report the results (Richardson & Watson, 2024). Table 1 summarizes what each step means.
What stands out in Table 1 is that step O is not just "fetching the data". It includes assessing whether the data are complete, accurate and permitted for use. As Section 7 shows, this is one of the boxes most often left empty in practice.
1.3. Shape and arrow conventions
The shapes in Figure 1 have specific meanings. A rectangle is an action; a box is an action, not a job title, so the same person can appear in several boxes. A diamond is a decision node. A rounded container is a data store. A filled circle marks the start and the end.
The label on an arrow is always what is handed over, not what the sender does. This small convention matters more than it looks: it forces whoever draws the diagram to answer "what exactly changed hands?". An arrow labelled "send report" says little; an arrow labelled "recommendation with three options and their trade-offs" tells the recipient exactly what to do next.
Figure 1 is a simplified version of the diagram used in the Vietnamese edition of this article. The side notes in the original (on the four confusions, the role of AI and the SOAR–CRISP-DM mapping) appear in Sections 5 and 6 below.
2. The five lanes
With the reading conventions in place, we can look at each lane. The five lanes in Figure 1 do not correspond to five departments or five job titles, but to five different kinds of responsibility within an analytics cycle. Table 2 summarizes which roles each lane contains, what it is responsible for and what it hands over.
Three points in Table 2 deserve attention. First, lane 1 has the fewest boxes in the diagram, only three. But the first one, how clearly the problem is stated, determines the quality of everything that follows. A vague question such as "why are sales poor?" produces a string of reports nobody uses; a question such as "should we close branch X before next quarter?" immediately tells you which data are needed and which analysis is enough.
Second, lane 2 is the only lane present at all four SOAR steps. The business analyst frames the question with the decision-maker at step S, assesses the data at step O, reads and checks the results at step A, and is accountable for the interpretation at step R. That is why this lane can be called the bridge between the business world and the data world.
Third, the data steward in lane 4, responsible for data quality, access rights and lineage, is the most often forgotten link. It is also the link that, when broken, makes every downstream analysis meaningless: a sophisticated model running on customer data with duplicates or wrong definitions still reaches wrong conclusions, only more convincingly.
3. Three branches after the report
Step R is not the end of the cycle. Right after it comes a decision node that the decision-maker and the business analyst answer together: are these results enough grounds to act? The answer leads to one of three branches, summarized in Table 3.
The middle branch in Table 3 is the most important and the most often omitted. If a diagram had only one exit leading to software development, readers would assume that analysis is valuable only when it becomes a new feature. That is a common and costly misunderstanding: many good analytics cycles end in a simple, fast and cheap management decision, such as changing a delivery schedule or stopping an ineffective promotion. This is also why Davenport and Harris (2017) stress that competing on analytics depends on how an organization makes decisions, not only on its technology.
4. Three feedback loops
If the three branches in Section 3 are the exits, Figure 1 also has three loops back, which turn the cycle into a loop rather than a straight line. Each corresponds to a reason analytics is never truly "done".
The first is that new software generates new data. Every time the "system change" branch is carried out, we also change the data the next cycle will observe. A new data field, a new data-entry process, a new customer app: each changes the picture the analyst sees next time, and analysts need to know this so they do not compare before-and-after figures mechanically.
The second is model drift alerts. A predictive model that performs well today can degrade as customer behaviour changes, competitors change strategy or the market suffers a shock. Without a monitoring loop, the model quietly goes wrong, and so do the decisions based on it, without anyone noticing.
The third is recursive SOAR. The next cycle starts with a sharper question drawn from the results of the previous one. The ability to come back with a better question is the difference between a data-mature organization and one that only produces periodic reports.
5. Four common confusions
The swimlane diagram is most useful for clearing up confusions that students and companies often fall into. This section covers four pairs of concepts that are often treated as the same: the two professions called "BA", the business analyst and the data analyst, the data analyst and the BI analyst, and finally SOAR's report step and CRISP-DM's deployment phase.
5.1. Business analyst and IT business analyst
This is the confusion that unsettles students most. The two professions share the title "BA" but sit in different lanes of Figure 1 and deliver different products. Table 4 compares the two roles.
As Table 4 shows, the IT business analyst appears only when the cycle enters the "system change" branch. The BABOK body of knowledge from the International Institute of Business Analysis describes business analysis in the broad sense, covering both directions (International Institute of Business Analysis, 2015); but in many job markets, Vietnam's among them, most "BA" job ads are really lane-5 positions tied to software projects. When reading a job ad, look for keywords such as "requirements specification", "user stories" and "working with the development team" to recognize lane 5; "analysing business figures", "proposing solutions" and "working with senior management" usually point to lane 2.
5.2. Business analyst and data analyst
These two roles are not the same, but in small companies one person often does both, so the line blurs. The line lies in the final product each must answer for.
A data analyst delivers an answer: revenue last month fell 12.5%, and most of the drop came from one particular branch. A business analyst delivers a recommendation with trade-offs: survey that branch before drawing conclusions about the whole market; option A takes three weeks but is more certain, option B is cheaper but riskier. The answer is evidence; the recommendation is how evidence is used to choose an action.
A quick test tells them apart: "If this result leads to a wrong decision, who has to explain it?" That person, in the cycle under discussion, is playing the business analyst.
5.3. Data analyst and BI analyst
This pair has the blurriest boundary, and many companies use the two titles interchangeably. Where there is a distinction, it usually lies on the axis of one-off versus recurring. A BI analyst builds reusable reporting systems: semantic models, standard metric sets, dashboards updated every week. A data analyst does one-off exploration: a new question comes up, they find the data, analyse it and answer.
The practical advice is to read the job description rather than the title. The very concept of "BI" has several interpretations too.
5.4. SOAR's report step and CRISP-DM's deployment phase
The last confusion is methodological. Students who learn both SOAR and CRISP-DM, a popular six-phase data-mining process (Chapman et al., 2000), often want to map the two frameworks one to one. Table 5 shows where they correspond and where they diverge.
The last row of Table 5 is where confusion is most likely. The technical deployment part of the deployment phase (putting the model into production, integrating it with systems and monitoring it) sits in lanes 4 and 5, outside SOAR. SOAR models analytical work, not a technology project. Treating the two as the same leads learners to think analysts are responsible for system deployment as well, and leads companies to give one person two very different blocks of work.
6. Which part is AI taking on?
A question data students often ask today is: if AI can write queries, build charts and draft reports, which lane in Figure 1 will disappear? The diagram helps answer this more concretely than general predictions. Table 6 splits the boxes into two groups according to how much AI can help.
Table 6 shows that AI makes producing evidence cheaper, so value shifts to asking questions and owning decisions. This does not mean lanes 3 and 4 disappear; it means each person in those lanes can do more, and people who can check AI's output become more valuable than those who can only run the tools.
7. When an AI agent runs the whole SOAR cycle
Section 6 treats AI as an assistant within each lane: a person still presses run and a person still reads the results. The next step, already visible in many companies, is an analytics agent: a large language model connected to tools for querying data, running code and sending notifications, which runs the SOAR cycle repeatedly on its own. Each morning it reads new data, computes metrics, spots deviations, reruns forecasts, proposes actions and sends a short report to the person in charge. The question is no longer "how does AI help me analyse" but "how far do I let AI run the analysis, and how do I supervise it".
7.1. Three levels of delegation
Figure 2 places three levels of delegation to an analytics agent on one axis, from decision rights held by people to decision rights held by the machine.
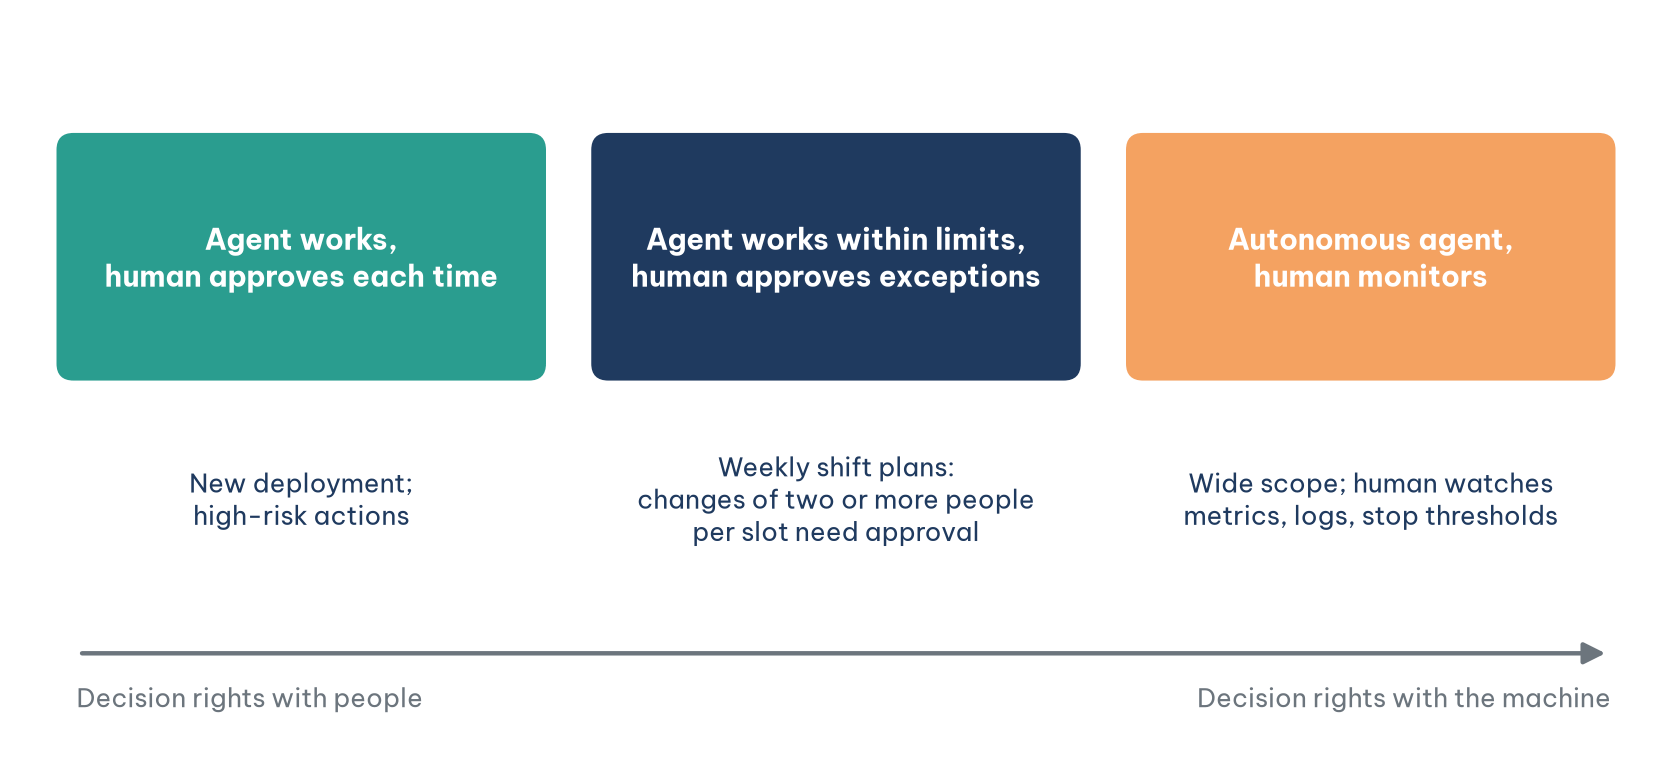
At the first level in Figure 2, the agent runs the analysis and drafts proposals while every action waits for human approval; this suits early deployment or high-risk actions. At the second level, the agent executes actions within preset thresholds and passes only exceptions to a person, for example a weekly shift plan that needs approval only when a slot changes by two or more people. At the third level, the agent decides within a broad scope while people watch aggregate metrics, read logs and step in when a stop threshold is reached.
7.2. Six criteria for choosing a level
Choosing a level is a management decision, not a technical one. Table 7 groups the considerations into six criteria. No single criterion decides; a type of decision should move towards automation only when most criteria lean that way.
Applied to a retail chain, weekly shift proposals lean almost entirely to the right-hand column: they recur every week, mistakes can be fixed the following week and feedback is fast, so an agent can run them at the second level. Opening a store in a province where the chain has never operated leans almost entirely to the left: rare, costly to get wrong, hard to undo and highly uncertain, so even if a model can propose an answer, the machine should only support. Credit decisions sit in the middle and call for care: they are frequent and data-rich, but they touch individual rights, so that row must be weighed on its own and not drowned out by volume.
7.3. Risks specific to analytics agents
Handing the whole cycle to a machine creates risks that do not exist when AI is only an assistant. Error propagation: an agent that goes wrong in an early step builds every later step on that error, with no person standing between steps to notice. Optimising the measurable: given a metric, an agent finds the fastest way to make it look good, including ways its designers never imagined; this is Goodhart's law, when a measure becomes a target it ceases to be a good measure. Hidden instructions in data: an agent reading customer emails or product reviews may meet text deliberately written as a command. Unseen performance drift: the report still arrives on time each morning while the data have changed and the forecasts are slowly going wrong. Diluted accountability: when a decision passes through the agent, the approver and the designer, each may assume someone else has checked.
Before letting an agent run for real, write an operating specification: its task, read and write permissions, self-execution thresholds, stop thresholds, logs, a set of test scenarios and post-deployment monitoring metrics, with a named person accountable for each type of decision. In the swimlane diagram of Figure 1, that specification is the work of lanes 1 and 2, exactly the part that Section 6 says still belongs to people.
8. Using the diagram as a diagnostic
Beyond helping with career choices, the swimlane diagram is also an organizational diagnostic. Using it is simple: print Figure 1 and mark the boxes that nobody does in your organization. Experience suggests three boxes are most often empty.
The first is data assessment at step O. Many teams jump straight from the question to writing queries, then discover the data are incomplete, wrongly defined or not permitted for use, after weeks of analysis. The second is the data steward: when nobody is responsible for data quality, every downstream analysis stands on sand. The third is closing the loop: very few organizations go back to measure whether the last recommendation actually created value, so they do not know what their analytics is worth.
Remember that the roles in the diagram are roles, not job titles or headcount. In a small company, two or three people can cover every box. What does not change with size is the order of hand-offs: question, data, evidence, recommendation, action.
Conclusion
Eight data job titles are confusing only when we look at them as a list. Placed in a cycle, they become links in a clear order: the decision-maker states the problem, the business analyst turns it into an analytical problem, data analysts and data scientists produce evidence on data prepared by engineers and data stewards, and the evidence comes back as recommendations and decisions. Only when a decision requires a system change do the IT business analyst and the software team step in.
For students, the diagram helps answer "which lane do I want to stand in?" rather than "which title do I want?". For companies, it helps reveal empty boxes before investing more in tools. And as AI makes evidence cheaper, it reminds us that the most durable value lies at the two ends of the cycle: asking the right question, and owning the decision.
References
Chapman, P., Clinton, J., Kerber, R., Khabaza, T., Reinartz, T., Shearer, C., & Wirth, R. (2000). CRISP-DM 1.0: Step-by-step data mining guide. SPSS.
Davenport, T. H., & Harris, J. G. (2017). Competing on analytics: The new science of winning (Updated ed.). Harvard Business Review Press.
International Institute of Business Analysis. (2015). A guide to the business analysis body of knowledge (BABOK Guide) (v3).
Richardson, V. J., & Watson, M. W. (2024). Introduction to business analytics. McGraw-Hill.
Discussion about this post