SOAR: A Four-Step Model for Business Analytics
Specify the question, obtain the data, analyze it and report the results, with a clear deliverable at every step


Key takeaways
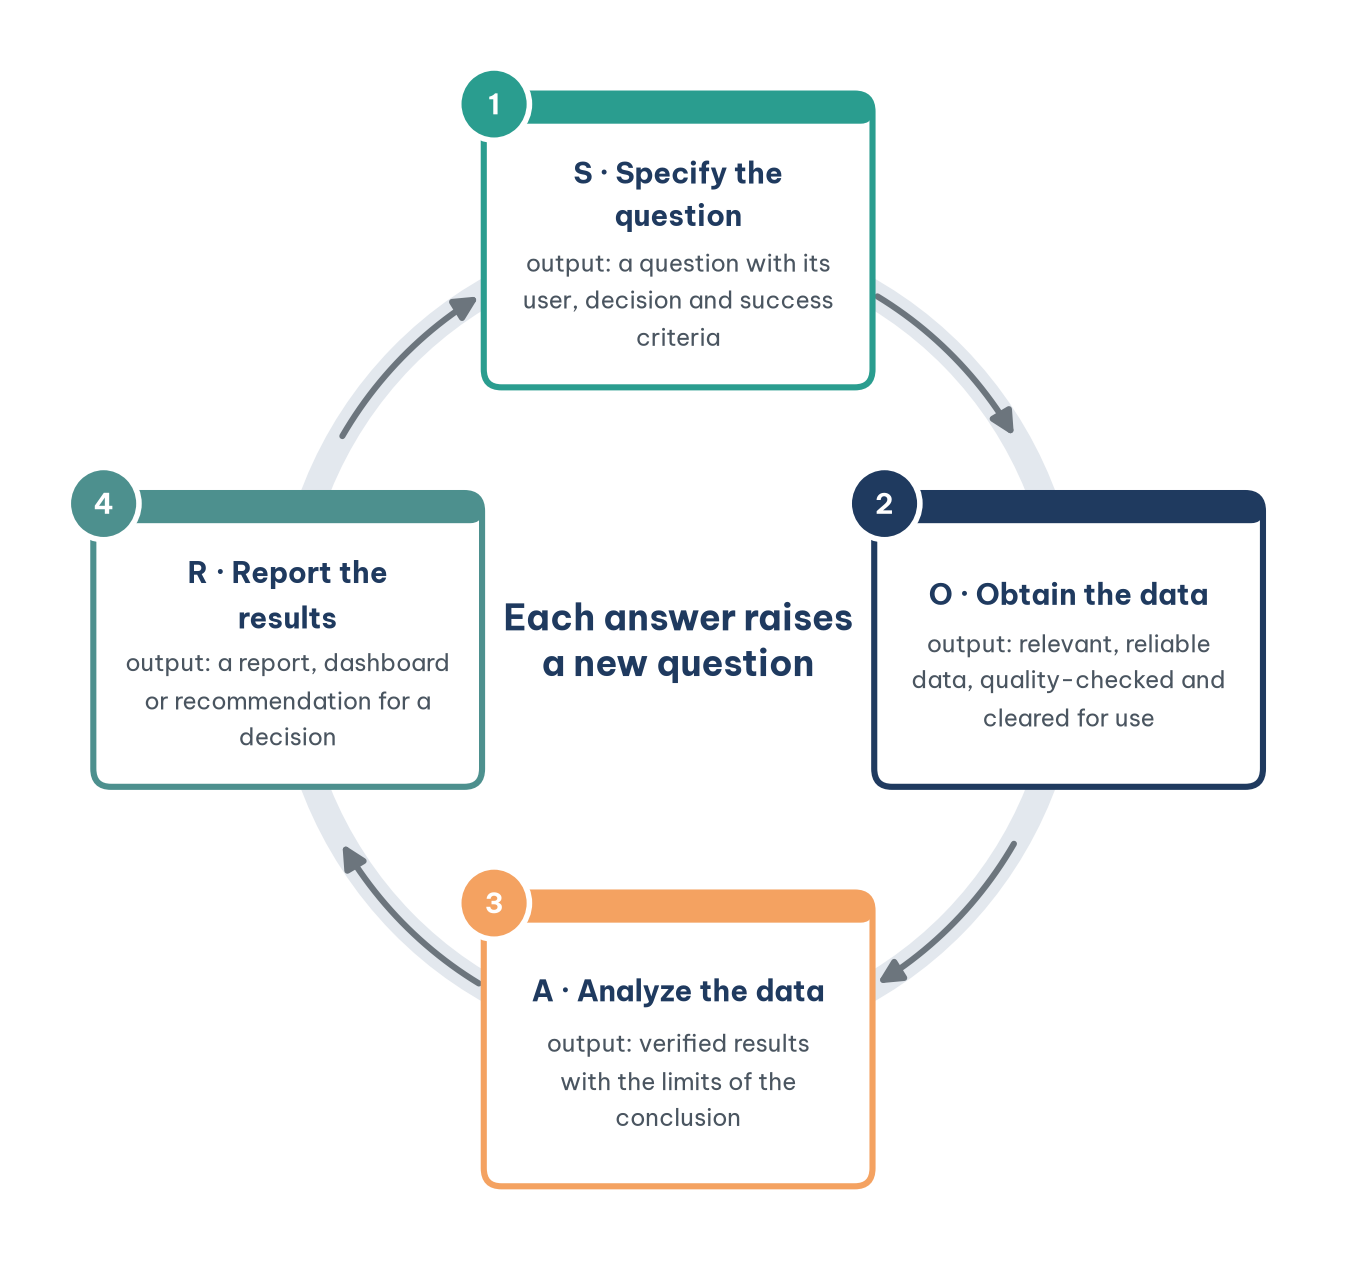
SOAR turns the four competencies of an "analytics mindset" into four steps: Specify the question, Obtain the data, Analyze the data and Report the results.
Each step produces a concrete deliverable, and the next step cannot start well until the previous deliverable is good enough.
The model is recursive: going back to an earlier step is not a failure of the process but its nature.
A full analytics problem has three dimensions: process (how), object (what is being analyzed) and purpose (what you want to know or decide).
Compared with Simon's decision cycle and CRISP-DM, SOAR describes analytical work that ends with a report; choosing, implementing and deploying belong to others.
A large American candy maker once lost an estimated US$150 million in Halloween sales simply because it could no longer trust its own data. After a troubled rollout of a new information system, the company did not know exactly where its stock was and could not deliver the right quantities to wholesalers and retailers during its best-selling season (Richardson & Watson, 2024). No question was wrong and no algorithm was weak; what broke was a link in the middle of the chain that leads from a question to a decision.
The story shows that business analytics is not a single act such as "running a model" or "drawing a chart" but a chain of steps, and the chain is only as strong as its weakest link. Analysts need a framework to move through that chain systematically, knowing which step they are on and what that step must deliver.
This article introduces such a framework: the SOAR analytics model. Section 1 connects SOAR to the idea of an analytics mindset. Section 2 walks through the four steps. Section 3 defines the deliverable of each step and explains why the cycle is recursive. Section 4 presents the three dimensions of an analytics problem. Section 5 places SOAR beside Simon's decision cycle and the CRISP-DM process.
1. The analytics mindset and the SOAR model
The professional services firm EY once declared that all its staff need an analytics mindset, and the expectation has since spread to many industries. According to EY, a person with an analytics mindset has four competencies: asking the right questions; extracting, transforming and loading relevant data; applying appropriate analytic techniques; and interpreting and sharing results with stakeholders (Banks & Christ, 2017).
The SOAR analytics model proposed by Richardson and Watson is a framework for remembering and practicing these competencies, in four steps named by their initial letters (Richardson & Watson, 2024). Table 1 shows the one-to-one correspondence between EY's four competencies and SOAR's four steps.
Table 1 is a reminder that SOAR is not a purely technical procedure. Two of the four steps, asking the question and interpreting the results, are skills of communicating with decision makers more than skills of handling data.
2. The four steps of SOAR
This section walks through each step, with the questions an analyst should ask at each one. Figure 1 summarizes the four steps as a loop.
2.1. Step S: specify the question
Every analysis starts with a question, and the quality of the question largely determines the value of the result. As a rule, the clearer and more specific the question, the better. A broad question such as "how can we increase sales?" is very hard to answer; a narrow one such as "how can we increase soft-drink sales through vending machines in one city next quarter?" is much easier. Narrowing the scope helps pin down which data to look for and which analysis to choose. Data does not speak for itself unless we ask it the right questions.
2.2. Step O: obtain the data
Once the question is clear, the analyst identifies which data are most useful for answering it: what kind of data is needed, what is already available, from which source, whether it is sufficient, whether it contains errors, gaps or bias, and whether it was collected ethically. Ideally the data are both relevant, closely connected to the question, and reliable, reflecting the truth with little or no bias.
Evans separates "reliability" into two ideas that are easily confused: data are reliable when they are accurate and consistent, giving the same result when measured twice; data are valid when they measure what they are supposed to measure (Evans, 2021). A call center can count calls with perfect accuracy, but the number of calls does not measure customer satisfaction; that figure is reliable but not valid for a question about satisfaction. The candy maker at the start of this article failed at this step.
2.3. Step A: analyze the data
With suitable data in hand, the analyst moves to the analysis itself, the technical core of the process. Depending on the question, the analyst chooses one of five types: descriptive, diagnostic, predictive, prescriptive, or adaptive and autonomous. The tool may be Excel, Power BI, Tableau, R or Python; what matters is that the technique fits the question, not the other way round.
2.4. Step R: report the results
However sharp an analysis is, it is worthless unless it is communicated effectively. Results can be presented in words, numbers, charts or a combination. A report can be static, published once and not updated, or dynamic, updated continuously and usually delivered through a dashboard. Tracking daily sales against target needs a dynamic report; a quarterly review may need only a static one.
3. What each step produces
The four SOAR steps are easily read as four tasks done in sequence. A more useful reading treats each step as a stage that produces a concrete deliverable, and the next stage cannot start until the previous deliverable is good enough. This section describes the four deliverables and then explains why the cycle must repeat.
3.1. Four deliverables
Table 2 lists the deliverable of each step and the signs that it is not yet good enough.
The last column of Table 2 is the most practical test: before moving on, ask whether the deliverable of the current step shows the sign of not being good enough.
One more point is often overlooked: a report is not a decision, and a decision is not an action. Step R provides input to the decision maker; choosing and implementing an option are their job. Only in adaptive and autonomous analytics is the analytical output wired directly into execution, and then the question "how far may the machine act on its own" becomes part of the problem.
3.2. Recursion
A core feature of SOAR is that it is recursive: after completing the four steps, both the analyst and the decision maker usually understand more and ask deeper questions (Richardson & Watson, 2024). The answer to one question raises new ones, like peeling an onion layer by layer. Viewing SOAR through its deliverables also explains why it must loop. While preparing data in step O, the analyst may discover that the question in step S is not feasible, for example because the data were stored only as monthly aggregates while the question needs individual orders. While analyzing in step A, the analyst may find that more data are needed. While reporting in step R, the audience asks new questions. Going back is not a failure of the process; it is the process.
The Netflix Prize is a complete illustration. From 2006, Netflix offered US$1 million to any team that could improve its movie recommendation system by at least 10%, and released a data set of more than 100 million movie ratings (Bennett & Lanning, 2007). The question (S) was clear and measurable; the data (O) were carefully prepared; thousands of teams analyzed them (A); results (R) were judged against a criterion announced in advance. And after the prize was awarded in 2009, the question kept changing with the way people watched films, exactly in the recursive spirit of SOAR.
4. Three dimensions of an analytics problem
SOAR answers only the question of how. An analytics problem is fully specified when two more questions are answered. Table 3 summarizes the three dimensions.
The three dimensions in Table 3 are independent, and confusing one with another is the source of many errors of reasoning. Saying "orders are a matter for predictive analytics" mixes up object and purpose: with the same orders, we can describe last week's late-delivery rate, diagnose why late deliveries rose, predict whether a new order will be late, or prescribe how to assign orders to reduce lateness. The type of analysis is decided by what we intend to do with the information, not by the object the information is about. Put in one sentence: within a defined business system, for a defined set of objects and scope of observation, we use SOAR to answer an analytics question with an appropriate method, producing a conclusion or action with clear limits.
5. SOAR beside Simon's cycle and CRISP-DM
SOAR is not the only process framework. Placing it beside two classic frameworks shows quite clearly the scope of business analytics as a profession. This section introduces the two frameworks and compares them.
5.1. Two classic frameworks
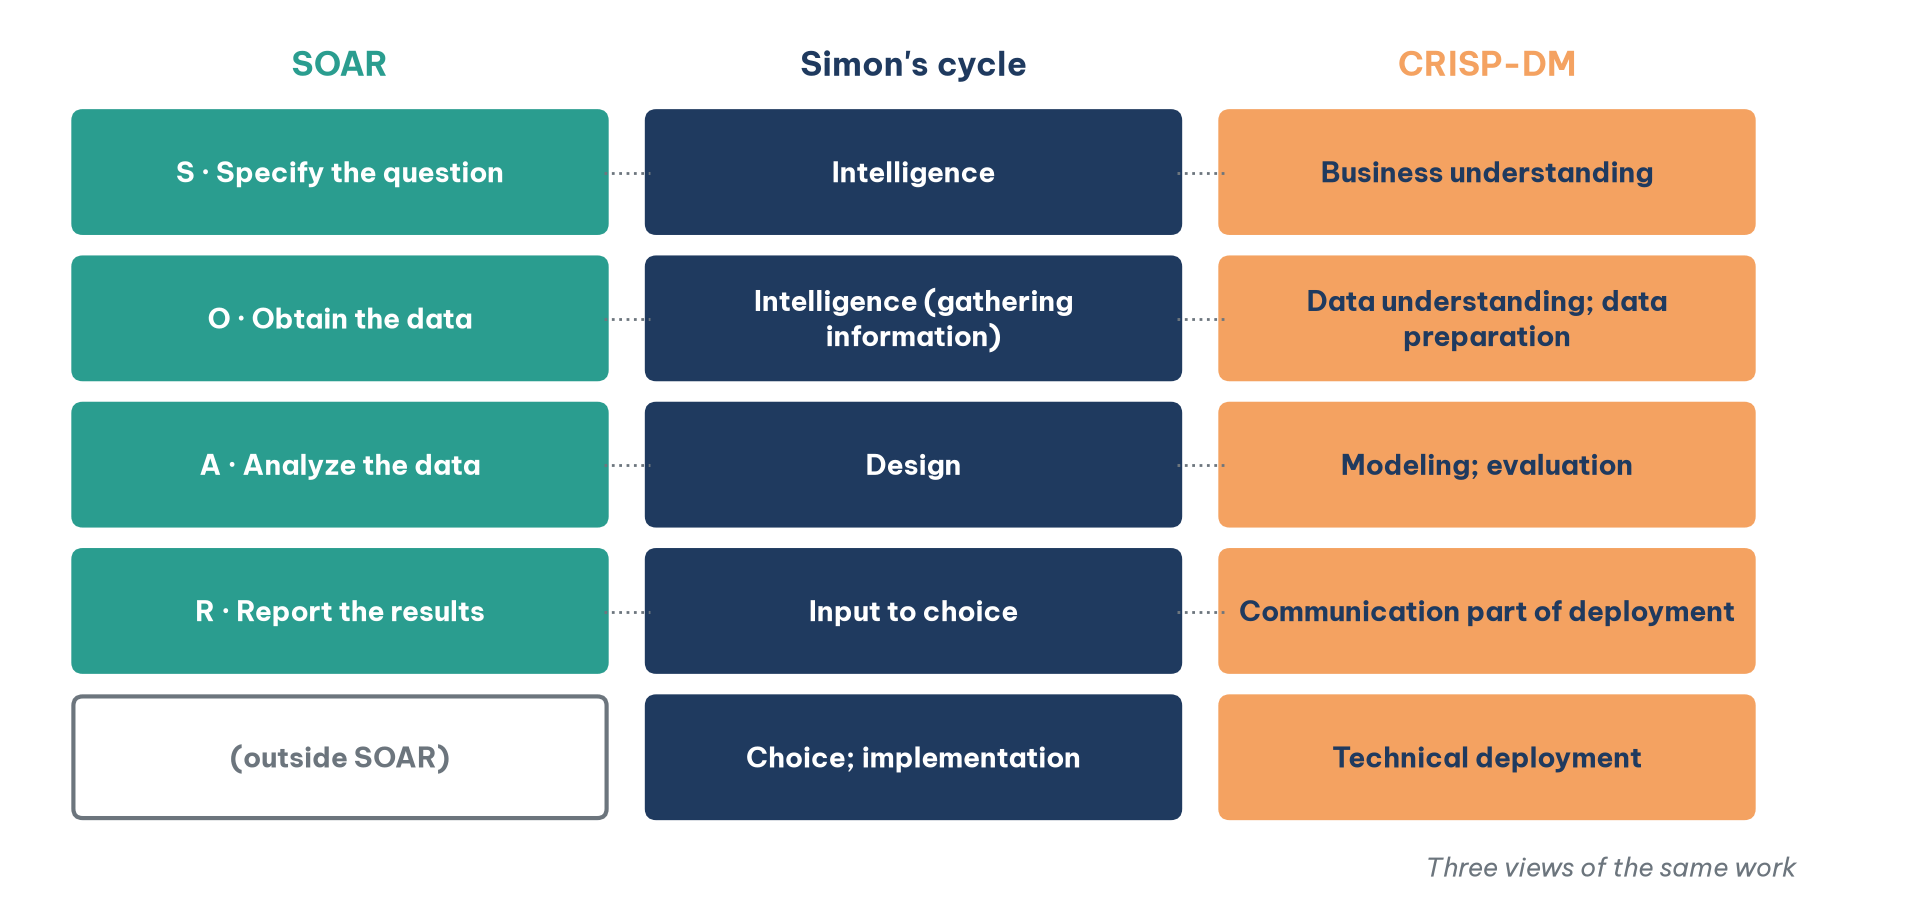
Simon's decision-making cycle has three phases: intelligence, recognizing and defining the problem; design, building models and alternatives; and choice, selecting an alternative. Many authors add a fourth phase, implementation (Sharda et al., 2024). CRISP-DM (Cross-Industry Standard Process for Data Mining), developed by a group of European companies in the late 1990s, has six phases: business understanding, data understanding, data preparation, modeling, evaluation and deployment (Chapman et al., 2000). The three frameworks do not compete; they describe the same work from the viewpoints of the decision maker, the analyst and the data mining project team. Figure 2 sets them side by side.
5.2. The core difference is scope
Figure 2 shows that SOAR describes analytical work: answering a question for a decision maker, ending when the results have been reported. CRISP-DM describes a data mining project: its product is usually a working model, and the project is finished only when the model is in operation. A question such as "how did each branch's third-quarter revenue change?" goes through all four SOAR steps without any modeling or deployment phase. Conversely, a project to build a credit-scoring system goes through all six CRISP-DM phases, of which SOAR's step R is only a small part. CRISP-DM also separates data preparation into its own phase, acknowledging that it is the most labor-intensive part; in SOAR, this work sits inside step O.
The two frameworks share their iterative nature: CRISP-DM draws an arrow from evaluation back to business understanding, matching SOAR's recursion. Side by side, they make the same point: after step R come tasks the analyst does not carry alone. The decision maker chooses and implements an option; when a recommendation requires changes to software, the technology team builds them. Knowing this boundary keeps analysts from taking on the work of a technology project, while not forgetting the step CRISP-DM makes into a phase of its own: checking whether the results actually meet the business objective.
Conclusion
The SOAR model turns the analytics mindset into four practicable steps: specify the question, obtain the data, analyze the data and report the results. Its value does not lie in four easy-to-remember letters but in the fact that each step has a concrete deliverable and the next step cannot start until the previous deliverable is good enough. From that perspective, going back to an earlier step is not failure but the recursive nature of analysis.
SOAR answers the question of how; the dimensions of object and purpose complete the definition of an analytics problem. Placed beside Simon's cycle and CRISP-DM, SOAR shows the scope of business analytics as a profession: answering the right question for the right decision, and knowing clearly what belongs to the decision maker and what belongs to the technology team.
References
Banks, C., & Christ, M. (2017, June 7). EY Academic Resource Center: An overview of analytics mindset competencies and case offerings [Webinar]. American Accounting Association. https://aaahq.org/Education/Webinars/6-7-17-EY-Academic-Resource-Center-An-Overview-of-Analytics-Mindset-Competencies-and-Case-Offerings
Bennett, J., & Lanning, S. (2007). The Netflix Prize. In Proceedings of KDD Cup and Workshop 2007. https://www.cs.uic.edu/~liub/KDD-cup-2007/proceedings/The-Netflix-Prize-Bennett.pdf
Chapman, P., Clinton, J., Kerber, R., Khabaza, T., Reinartz, T., Shearer, C., & Wirth, R. (2000). CRISP-DM 1.0: Step-by-step data mining guide. SPSS Inc. https://s2.smu.edu/tfomby/eco5385_eco6380/data/SPSS/CRISPWP-0800%20Data%20Mining%20Standards.pdf
Evans, J. R. (2021). Business analytics: Methods, models, and decisions (3rd ed., Global ed.). Pearson Education. https://www.pearson.com/store/p/business-analytics-global-edition/P200000004157/9781292339061
Richardson, V. J., & Watson, M. W. (2024). Introduction to business analytics. McGraw Hill. https://www.mheducation.com/highered/product/introduction-business-analytics-richardson-watson/9781265450175.html
Sharda, R., Delen, D., & Turban, E. (2024). Business intelligence, analytics, data science, and AI: A managerial perspective (5th ed.). Pearson. https://www.pearson.com/en-us/subject-catalog/p/business-intelligence-analytics-data-science-and-ai/P200000009781
Discussion about this post