Known Knowns, Unknown Unknowns and the Rumsfeld Matrix in Data Analysis
How the four quadrants of known and unknown help data teams ask better questions, manage uncertainty and catch model-breaking surprises


Key takeaways
The Rumsfeld matrix crosses two questions, do we know it and are we aware of it, to give four quadrants: known knowns, known unknowns, unknown knowns and unknown unknowns. Each quadrant calls for a different tool and a different attitude.
Known knowns are the place to execute, but "known" facts such as metric definitions and date formats still need checking. Known unknowns, such as missing data or forecast error, are where most statistical techniques earn their keep.
Unknown knowns are knowledge already sitting in the data, in forgotten reports or in experts' heads. They are worth mining, but every "discovery" needs testing before it becomes strategy, as the beer-and-diapers legend shows.
Unknown unknowns cannot be predicted, only detected and answered. Model monitoring does not prevent a shock, but it decides how long the shock lasts: in a simple simulation, monitoring cut the error after a shock from about 20% back to about 10%.
Many of a data team's unknown unknowns are already known to someone else. The further a question sits from "known", the more people from outside the data team should help answer it.
Every organization that relies on data eventually meets the same unpleasant surprise. A demand forecasting model that worked well for years suddenly becomes useless. A fraud detector that scored almost perfectly in testing fails as soon as it goes live. A forecast presented as a single, confident number turns out to have a margin of error far wider than anyone in the meeting imagined. In each case the problem was not a lack of data or computing power. It was a failure to recognize what kind of uncertainty the team was facing.
A useful way to name those kinds of uncertainty came from an unlikely source. At a Pentagon news briefing on February 12, 2002, a reporter asked the U.S. Secretary of Defense, Donald Rumsfeld, whether there was evidence that Iraq had tried to supply terrorists with weapons of mass destruction. Rumsfeld answered: "Reports that say that something hasn't happened are always interesting to me, because as we know, there are known knowns; there are things we know we know. We also know there are known unknowns; that is to say we know there are some things we do not know. But there are also unknown unknowns," which he described as "the ones we don't know we don't know." He added that "it is the latter category that tend to be the difficult ones" (Rumsfeld, 2002).
The remark was widely mocked as a tongue twister, and it was made in a charged political context. Yet, almost by accident, it became one of the most useful mental models for complex fields, and data science in particular. For a data scientist, the job is not just running algorithms on a clean dataset. It is a journey of discovery that keeps running into uncertainty and, now and then, into shocks nobody saw coming. The Rumsfeld matrix gives a name to each kind of uncertainty and, more importantly, helps choose the right tool for each one.
This article has six sections. Section 1 traces the origins of the matrix and lays out its four quadrants. The next four sections take each quadrant in turn: known knowns (Section 2), known unknowns (Section 3), unknown knowns (Section 4) and unknown unknowns (Section 5), each with examples from data projects and concrete actions. Section 6 follows an email marketing project through all four quadrants and draws out how a data project manager can use the matrix as a checklist.
1. Where the matrix comes from and how it is built
This section shows that the idea behind Rumsfeld's remark is older than the remark itself, then sets out the two axes and four quadrants used in the rest of the article.
The idea was not new. In 1955 the psychologists Joseph Luft and Harrington Ingham used a similar grid, the Johari window, to analyze self-awareness: the things I know about myself that others also know, the things I know that others do not and the reverse (Luft & Ingham, 1955). In project management and risk management, the distinction between risks that are "known" and risks that were "never anticipated" has been in use for a long time as well.
Rumsfeld named only three quadrants. The fourth, unknown knowns, things we do not know that we know, was pointed out by the philosopher Slavoj Žižek in 2004 in a commentary on that very remark (Žižek, 2004). For Žižek, unknown knowns are things an organization actually knows but chooses not to acknowledge. In data science the quadrant is read more broadly: knowledge that already sits in the data or in people's heads inside the organization, but whose value nobody has yet recognized.
Put together, the four quadrants form a 2 × 2 matrix with two axes:
The knowledge axis: what we know and what we do not know.
The awareness axis: what we are aware of and what we are not aware of.
Figure 1 shows these four regions of knowledge as they apply to data science.
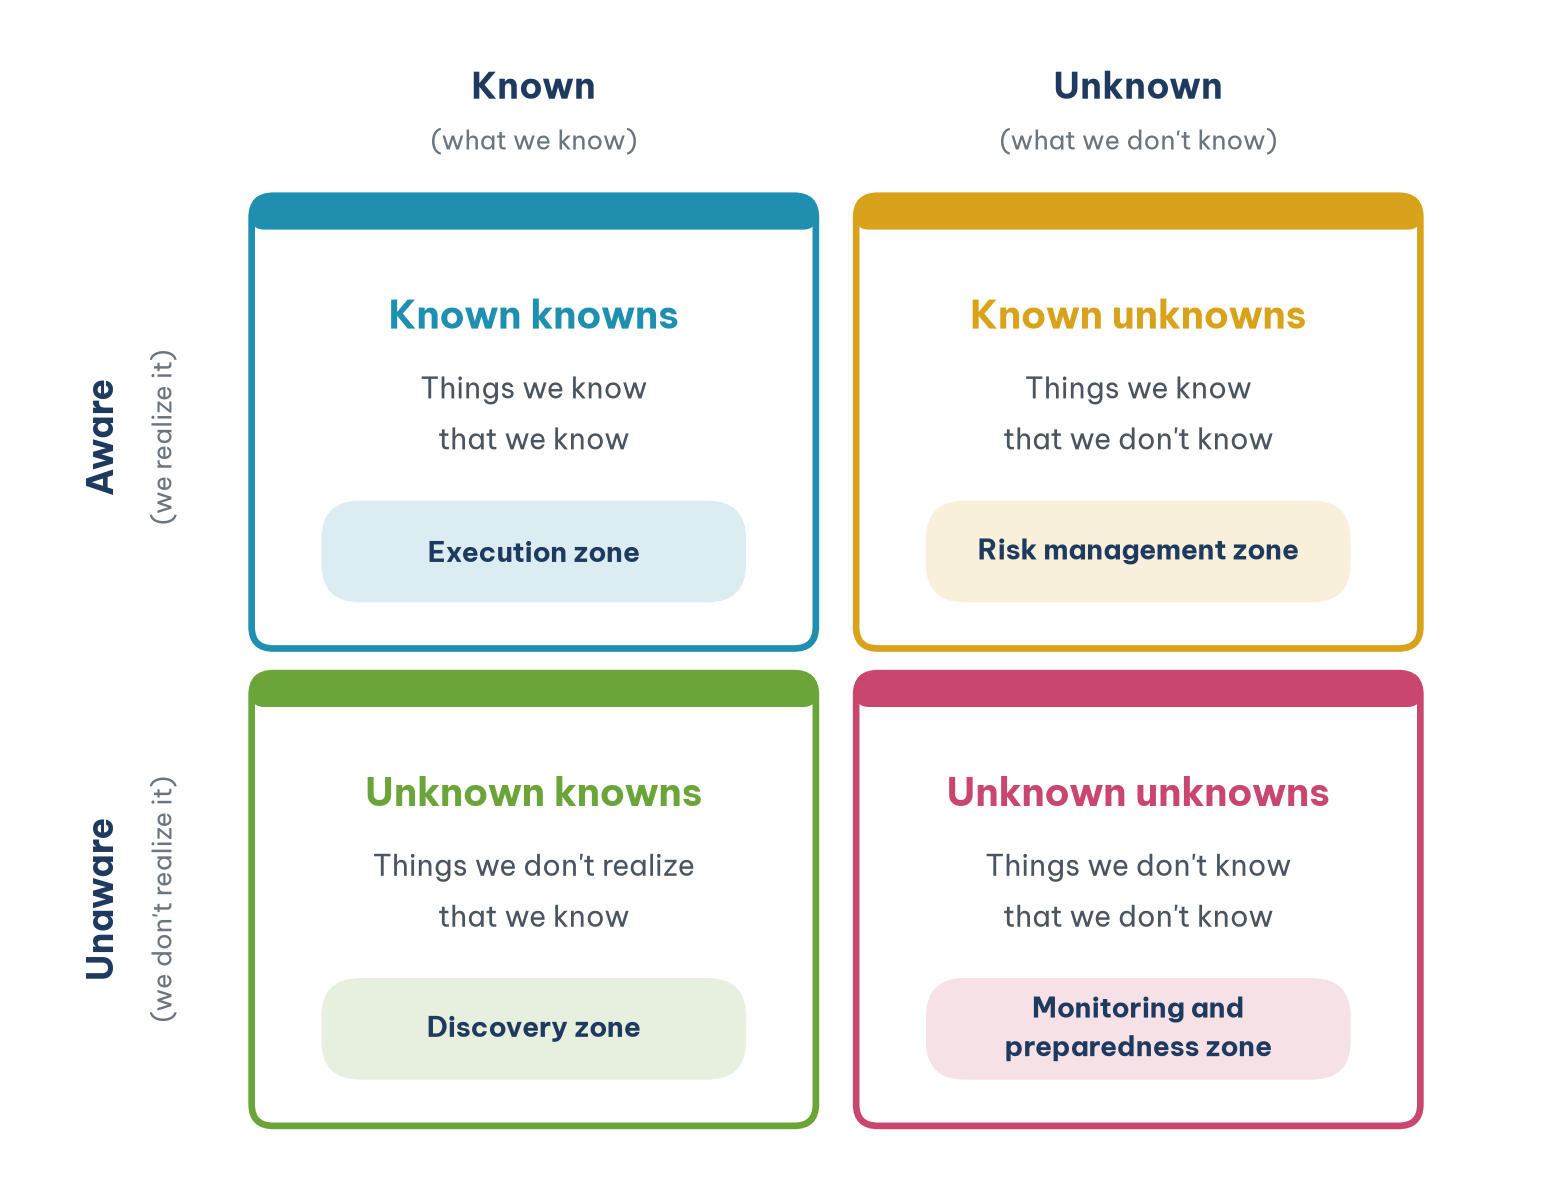
The four quadrants of Figure 1 can be read as follows:
Known knowns (top left, blue): the execution zone. These are the clear data and objectives you already hold.
Known unknowns (top right, amber): the risk management zone. These are risks or gaps in information that you are aware of and can plan for, such as missing data.
Unknown knowns (bottom left, green): the discovery zone. These are "gold mines" of knowledge hidden in your data that you have not yet noticed; your job is to dig them out.
Unknown unknowns (bottom right, pink): the monitoring and preparedness zone. These are the blind spots that can break your model. You cannot predict them; you can only prepare to detect them and respond.
Table 1 summarizes the four quadrants with the main tools and the attitude each one requires. The following sections go through each row in detail.
The figure and the table make the same point: a data scientist's job is not only to process what is already known. It is a continuous journey of uncovering what has not yet been noticed, managing risk and building systems sturdy enough to survive surprises. The natural place to start is the safest quadrant.
2. Known knowns: the foundation for execution
This section covers the quadrant where most projects begin, and shows why even what we "know" deserves a second look.
Definition: things we know that we know.
In data science this is the safe zone and the starting point of every project. It includes all the information assets that are clear and structured, together with the objectives that have already been defined.
2.1. Example
Picture a typical project. Available data: you have a customer database with well-defined columns: customer ID, age, products purchased and sign-up date. Business objective: management asks for a model to "identify the 20% of customers most likely to churn next quarter". Known tools: you know that logistic regression, random forests or gradient boosting can all handle this kind of classification problem.
2.2. Actions
This is the execution stage, where basic knowledge and skills are put to work.
Descriptive analytics: use the data to build reports, dashboards and statistics on the current situation, for example "the churn rate last quarter was 5%".
Build a baseline model: quickly set up a simple model to serve as a yardstick for more complex models later. If a complex model is not meaningfully better than the baseline, use the baseline: it is easier to explain, easier to maintain and less risky.
2.3. "Known" can still be wrong
One important caution: things we think we already know also need checking. The "sign-up date" column may be stored in two formats in two systems, day/month in one and month/day in the other. Two departments may define "active customer" differently. The 5% churn rate may hold only for prepaid customers. In other words, part of the known knowns quadrant is really "things we think we know". Checking them again is the first step of data exploration and the cheapest way to avoid large mistakes later on.
Once you are standing firmly on what you know, the next question is: what do I know that I am missing?
3. Known unknowns: quantifying and managing uncertainty
This section deals with uncertainty that can be anticipated and measured, the territory where most statistical techniques do their work.
Definition: things we know that we do not know.
Here we are aware of a gap in information or of randomness in the process, and we actively look for ways to bring it under control.
3.1. Examples
Missing data: you find that 30% of customers in the dataset have no income information. You know you lack this information and you know it may affect the model.
Hyperparameter tuning: you know the model needs settings such as the number of trees, the maximum depth or the learning rate, but you do not know which values work best.
Forecast uncertainty: a sales forecasting model puts next month's sales at $400,000. You know the actual figure will differ and you need to show decision makers by how much.
3.2. Actions
Handle missing data. There are many imputation techniques: fill in the mean or median, use a small model to estimate the missing values, or add a flag variable that records whether a value was missing. But before choosing a technique, ask why the data are missing. If high earners tend to leave the income question blank, then the missingness is itself information, and filling it with the mean will bias the model. The question "why is it missing?" often matters more than the question "what should I fill it with?".
Tune and validate. Use cross-validation to assess the model objectively, and search methods such as grid search or Bayesian optimization to find a good set of hyperparameters.
Quantify and report uncertainty. Instead of giving a single forecast, provide a prediction interval: "next month's sales will be between $380,000 and $420,000, with 90% confidence". Probabilistic models or quantile regression can produce such intervals. Decision makers need to know how firm a number is: an inventory plan built on "$400,000 ± $20,000" looks very different from one built on "$400,000 ± $120,000".
The known unknowns quadrant is where most statistical techniques prove their worth. But there is a kind of knowledge that ordinary statistics will not find on its own, because nobody asks about it.
4. Unknown knowns: the forgotten gold mine
This section looks at knowledge an organization already has without realizing it, and at why every "discovery" in this quadrant must be tested before anyone acts on it.
Definition: things we are not aware that we know.
In data science these are pieces of information or knowledge that already exist in the data or in the organization's tacit knowledge but have been overlooked, forgotten or never valued. They are gems buried in a pile of raw data.
4.1. Examples
A hidden customer segment. Your company segments customers by age and region. But the web log data hide a completely different segment: people who tend to shop after 10 p.m., with small baskets and a high order cancellation rate, spread across every age group and every region. The data have been there for a long time; nobody had looked at them from that angle.
Experts' tacit knowledge. A veteran technician has an excellent "feel" for when a machine is about to fail: he can tell from the sound. But he cannot write it down as a rule. This knowledge exists in the organization, yet the data systems know nothing about it.
The forgotten report. A department ran a customer survey two years ago; the results sit in a folder that nobody opens. A new project spends three months collecting exactly the same information again.
4.2. Beer and diapers: a legend that needs checking
The most famous example for this quadrant is the "beer and diapers" story: a supermarket chain analyzed billions of transactions, found that men often bought beer together with diapers on Friday evenings, then placed the two items side by side and boosted sales. The story is told in countless data mining textbooks and presentations.
The reality is far more modest. According to insiders interviewed by Power (2002), the original story was an analytics project for the Osco Drug pharmacy chain in the United States in the early 1990s. The analysts did find a correlation between beer and diapers in a late afternoon time window, but nobody changed any store layout on the strength of that finding. The anecdote was retold again and again, embellished along the way, until it became an industry "fact".
The story therefore teaches a different lesson from the one it is usually used to illustrate: a "discovery" in the unknown knowns quadrant must be tested before it becomes strategy. A correlation found by sifting through thousands of product combinations can very easily be a fluke. Testing it, with fresh data or with a small experiment, is what separates a finding from an anecdote.
4.3. Actions
From the analysis above, four concrete steps help turn unknown knowns into knowledge that actually gets used.
Deep exploratory data analysis (EDA): do not stop at basic charts. Use dimensionality reduction techniques such as PCA or t-SNE to visualize complex relationships.
Unsupervised learning: use clustering algorithms to find natural groups of customers, or association rules to find purchasing patterns.
Capture expert knowledge: hold interviews and workshops with business experts to turn their tacit knowledge into new features for the model. In the technician's case, you could fit acoustic sensors and ask him to label the moments when he "hears a problem".
Take inventory of your data: build a data catalog so the organization knows what data it has, who holds it and where it lives. This is the simplest way to turn forgotten reports into assets.
The first three quadrants all contain things we can act on deliberately. The last quadrant is different: it holds things we cannot go looking for, only prepare to meet.
5. Unknown unknowns: preparing for what cannot be foreseen
This section examines the most dangerous quadrant, asks whose blind spot a "black swan" really is, and uses a simulation to show why monitoring is the main line of defense.
Definition: things we do not know that we do not know.
This is the most dangerous zone and the source of the biggest failures. It contains events and forces you did not anticipate at all when you built the model: true blind spots.
5.1. Examples
A macro shock. A supply chain forecasting model that worked well for years suddenly becomes useless when the COVID-19 pandemic breaks supply links and upends buying behavior.
A competitor changes the rules. A customer lifetime value model never considered the possibility that a new company would appear and offer a similar service for free, changing customer behavior across the board.
Subtle data leakage. A fraud detection model reaches 99.9% accuracy in training but fails in deployment. The reason: the variable "transaction processing time" had quietly absorbed information about the outcome, because fraudulent transactions were held for investigation and therefore took longer. That variable is not available at the moment a prediction is needed. You did not know that you did not know about the leak. Kaufman et al. (2012) show that leakage is one of the most common mistakes in data mining, including in major competitions.
5.2. Whose black swan?
Taleb (2007) calls rare events with very large impact, which are "explained" only after the fact, black swans. COVID-19 is often cited as the textbook example. Yet Taleb himself has argued that the pandemic was a "white swan": epidemiologists had warned for years about the possibility of a global pandemic, and many health organizations had response plans in place.
The distinction is not just a matter of words. For a retailer's demand forecasting model, the pandemic was an unknown unknown: no variable in the model said anything about disease. For public health experts, it was a known unknown: they knew it could happen, just not when. The lesson: many of a data team's unknown unknowns are already known to someone else. Widening the sources of information, by asking industry experts, the legal department, partners and customers, is how they get moved into a quadrant that is easier to manage.
5.3. Model monitoring: the main line of defense
If a shock cannot be predicted, it must at least be detected quickly when it happens. Figure 2 illustrates the point with a simple simulation.
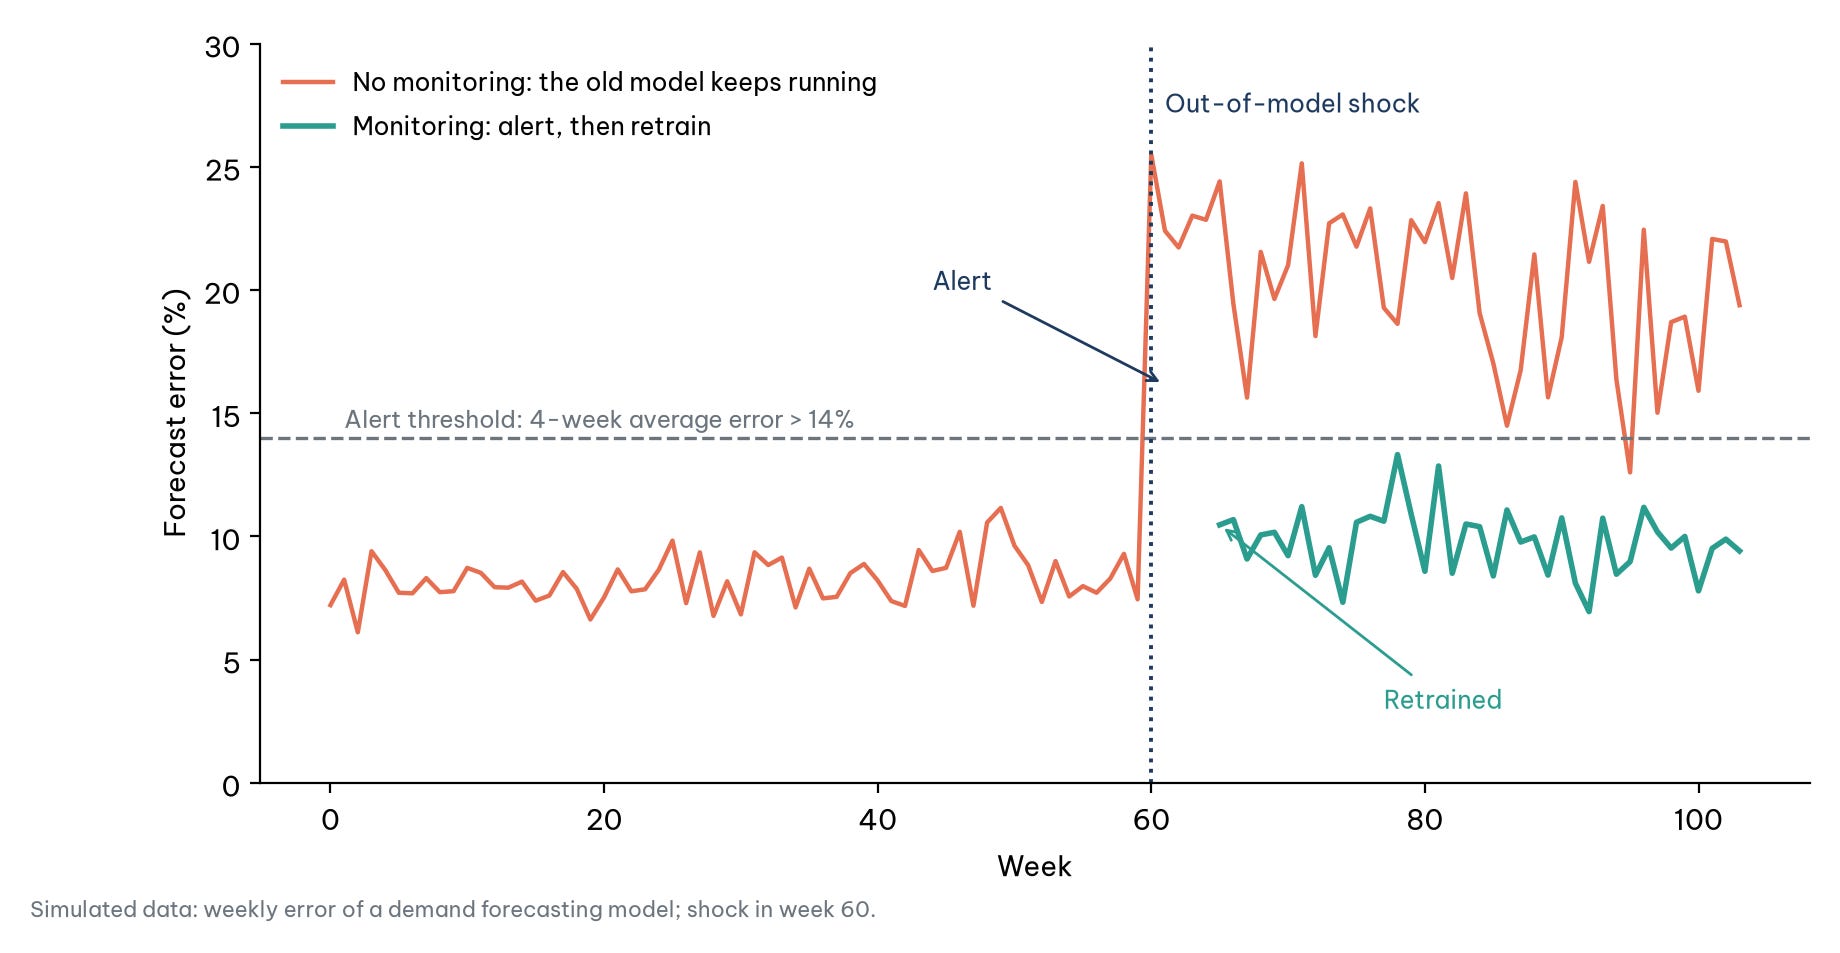
In the simulation in Figure 2, a demand forecasting model has an average error of about 8% over the first 60 weeks. In week 60 a shock occurs and the error jumps above 20%. Without monitoring, the old model keeps running and its average error from week 65 onward stays at about 20%: for roughly nine months, every purchasing decision rests on a forecast more than twice as wrong as usual. With monitoring, using a simple alert rule of "four-week average error above 14%", the system raises an alert in week 61. The data team has four weeks to find the cause and retrain the model on new data; from week 65 the error falls back to about 10%.
The simulation simplifies a great deal, but it makes the core point: monitoring does not prevent the shock, but it decides how long the shock lasts.
5.4. Actions
Because unknown unknowns cannot be foreseen, preparing for them comes down to detecting early and responding fast. The six actions below run from technical measures to the working habits of the team.
Build a model monitoring system: track performance on live data continuously; raise an alert when the distribution of the input data shifts (data drift) or when the relationship between inputs and outputs changes (concept drift) (Gama et al., 2014). This is the most important line of defense.
Design flexible systems: favor models that are not overly complex and are easy to retrain, and an MLOps architecture that allows models to be updated quickly when new data arrive or performance drops (Sculley et al., 2015).
Chaos engineering: deliberately "break" the system in controlled ways, such as feeding in noisy data or simulating a failed data source, to see how the model and the system respond. Netflix pioneered the idea for software infrastructure, and it carries over well to data pipelines.
Pre-mortem: before deployment, the whole team imagines that the model has failed six months from now and writes down every possible reason (Klein, 2007). The technique pushes people to voice worries they would normally keep to themselves, turning some unknown unknowns into known unknowns.
Stay humble and keep asking questions: "Which of my assumptions is most likely to be wrong?" and "What could make this model fail completely?"
Learn from incidents: every model failure is a chance to identify an unknown unknown that has just become a known unknown and add it to the list of things to watch.
So far the four quadrants have been presented one at a time. In a real project they do not stand still; a project moves through all four, and that is the subject of the final section.
6. A journey through the four quadrants
This section follows one project around the matrix, then turns the matrix into a review checklist for people who manage data projects.
Data science is not a static job carried out inside the known knowns quadrant. It is a continuous cycle that moves between the regions.
6.1. An email marketing project
Figure 3 follows an online retailer that wants to grow revenue from email marketing as it passes through all four quadrants.
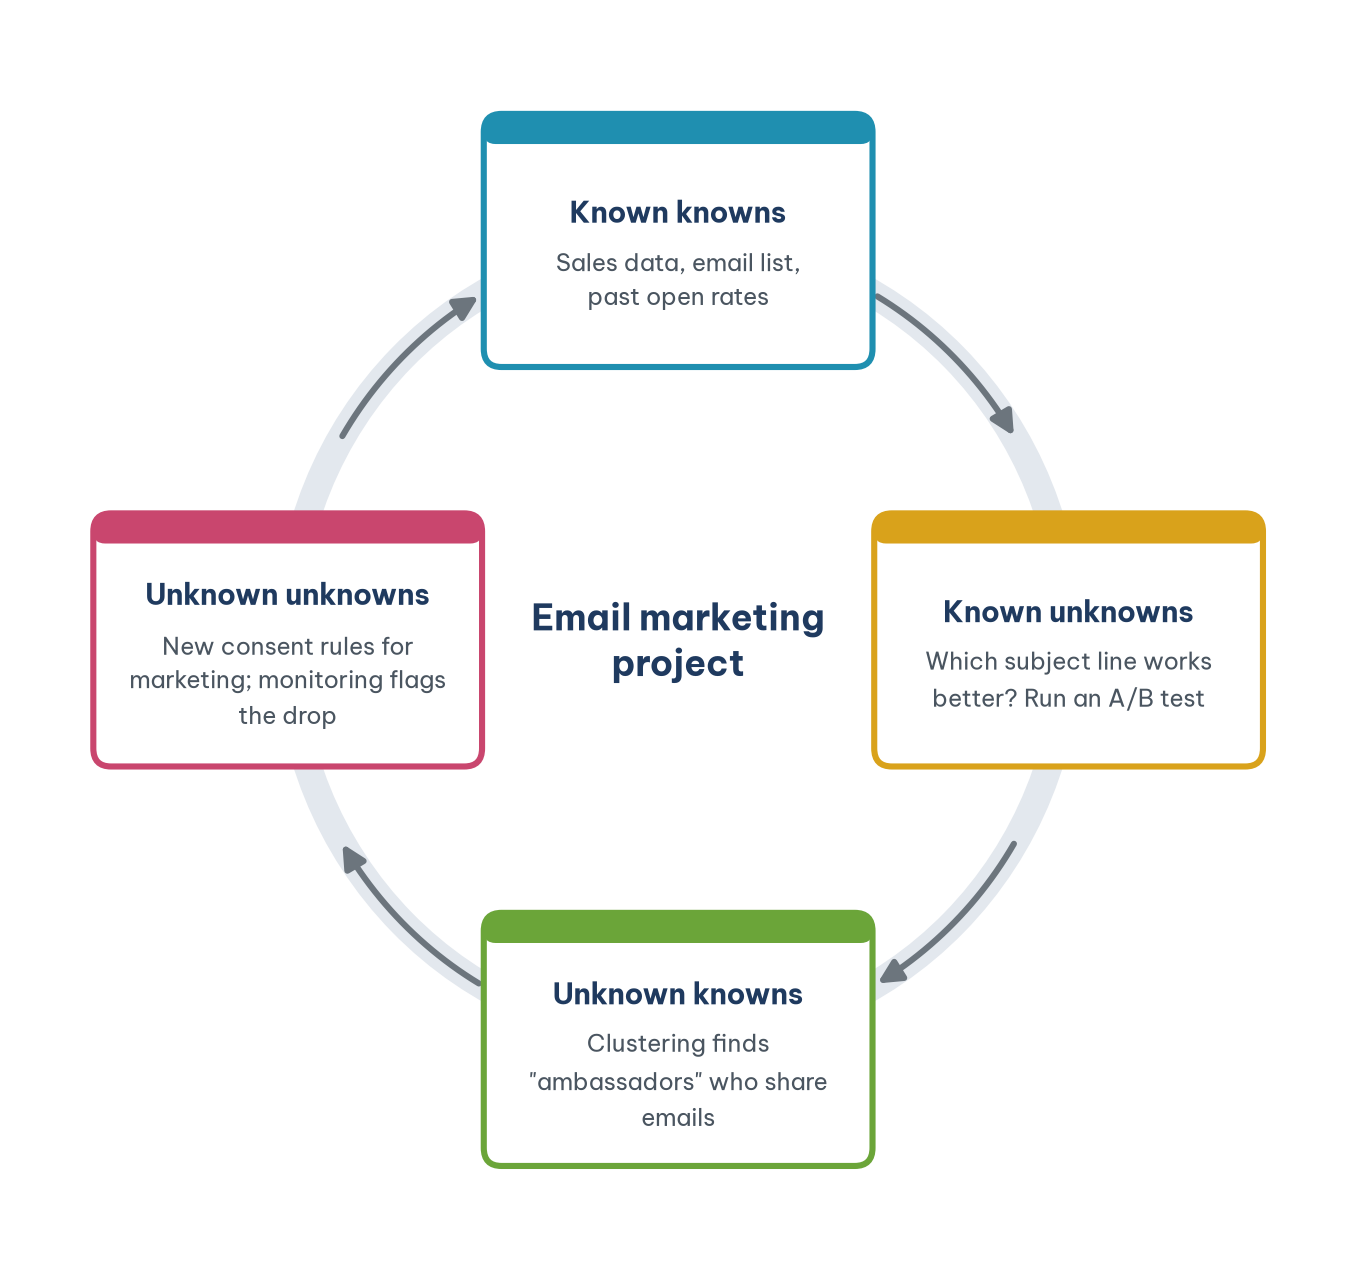
Known knowns. The company has sales data, a customer email list, open rates from previous months and a clear objective: increase revenue from the email channel.
Known unknowns. The team knows it does not know which subject line performs better. It runs an A/B test with two subject lines to find out. This is a known unknown that the team tackles head on.
Unknown knowns. While analyzing the test results, a curious data analyst decides to cluster the people who opened the emails. She finds a small but very active group: people who not only open the emails but also share them on social media. This group of "brand ambassadors" had been sitting in the data all along, unnoticed. The company tests the finding by offering a refer-a-friend program to part of the group, sees that it works, then rolls it out.
Unknown unknowns (for the data team). A new data protection law requires explicit customer consent for marketing, so part of the email list can no longer be used as before. The data team does not follow policy news and is caught by surprise. The legal department, however, had known since the law was in draft: one more example of the point made in Section 5.2. Such rules rarely arrive overnight. The European Union's General Data Protection Regulation, for instance, was adopted in 2016 and applied only from May 25, 2018 (European Parliament & Council of the European Union, 2016), a two-year lead time during which a surprise was entirely avoidable for anyone who was watching.
Thanks to its monitoring system, the company notices that email delivery rates and email revenue are falling. It reviews how it collects customer consent and, from then on, adds "track regulatory changes" to the risk list of every data project, moving the issue into the known unknowns quadrant. A new cycle begins.
6.2. The Rumsfeld matrix for data project managers
The example suggests a practical use: treat the matrix as a checklist at the start of every project and at each periodic review. Table 2 proposes some questions for each quadrant.
The last column of Table 2 deserves attention: the closer a question sits to the "unknown" quadrants, the more people from outside the data team are needed. That is because what the team does not know is often exactly what someone else does.
Table 3 brings together the examples and actions from the whole article by quadrant, for use as a quick reference page.
Conclusion
The Rumsfeld matrix teaches a lesson that is simple to state and hard to practice: stand firmly on what you know, but check it; actively quantify and manage what you know you do not know; keep searching for hidden knowledge and test it before you believe it; and above all, prepare to detect quickly the things you cannot even imagine.
What makes the matrix interesting is that its quadrants are not fixed. Every time a data team asks an expert, rereads an old report or analyzes a failure, part of the "unknown" region moves into the "known" region. A learning organization is not one without blind spots; it is one that shrinks its blind spots faster than others do. That is the essence of science and discovery.
The matrix is useful beyond data science as well. The same two questions, do we know it and are we aware of it, can structure a product roadmap, a risk register or a search for new business ideas, wherever the cost of being surprised is high.
References
European Parliament & Council of the European Union. (2016). Regulation (EU) 2016/679 of 27 April 2016 on the protection of natural persons with regard to the processing of personal data and on the free movement of such data (General Data Protection Regulation). Official Journal of the European Union, L 119, 1–88. https://eur-lex.europa.eu/eli/reg/2016/679/oj
Gama, J., Žliobaitė, I., Bifet, A., Pechenizkiy, M., & Bouchachia, A. (2014). A survey on concept drift adaptation. ACM Computing Surveys, 46(4), Article 44. https://doi.org/10.1145/2523813
Kaufman, S., Rosset, S., Perlich, C., & Stitelman, O. (2012). Leakage in data mining: Formulation, detection, and avoidance. ACM Transactions on Knowledge Discovery from Data, 6(4), Article 15. https://doi.org/10.1145/2382577.2382579
Klein, G. (2007). Performing a project premortem. Harvard Business Review, 85(9), 18–19. https://hbr.org/2007/09/performing-a-project-premortem
Luft, J., & Ingham, H. (1955). The Johari window: A graphic model of interpersonal awareness. In Proceedings of the Western Training Laboratory in Group Development. University of California, Los Angeles.
Power, D. J. (2002, November 10). What is the "true story" about data mining, beer and diapers? DSS News, 3(23). http://www.dssresources.com/newsletters/66.php
Rumsfeld, D. H. (2002, February 12). DoD news briefing – Secretary Rumsfeld and Gen. Myers. U.S. Department of Defense. https://archive.defense.gov/Transcripts/Transcript.aspx?TranscriptID=2636
Sculley, D., Holt, G., Golovin, D., Davydov, E., Phillips, T., Ebner, D., Chaudhary, V., Young, M., Crespo, J.-F., & Dennison, D. (2015). Hidden technical debt in machine learning systems. Advances in Neural Information Processing Systems, 28. https://proceedings.neurips.cc/paper/2015/hash/86df7dcfd896fcaf2674f757a2463eba-Abstract.html
Taleb, N. N. (2007). The black swan: The impact of the highly improbable. Random House. https://www.penguinrandomhouse.com/books/176226/the-black-swan-second-edition-by-nassim-nicholas-taleb/
Žižek, S. (2004, May 21). What Rumsfeld doesn't know that he knows about Abu Ghraib. In These Times. https://inthesetimes.com/article/what-rumsfeld-doesn-know-that-he-knows-about-abu-ghraib
Discussion about this post