One Database Schema, Many Ways to Draw an ERD
Why two entity relationship diagrams that look nothing alike can still describe exactly the same database schema correctly


Key takeaways
A database schema is a description of the structure of data, not the data itself. The same schema can be shown at three levels (conceptual, logical, physical) and drawn in several notations.
Chen, extended (min, max), crow's foot, Barker, IDEF1X and UML class diagrams carry the same information in different "alphabets". None of them is more correct than the others.
The most dangerous difference is where cardinality is written: Chen, crow's foot and UML read look-across, while (min, max) reads look-here. Copying numbers between them without swapping reverses the business rule.
The word "schema" means different things in MySQL, PostgreSQL, Oracle and SQL Server, and many misconceptions (one entity equals one table, relational means "tables with relationships", NoSQL needs no schema) come from loose terminology.
Before reading any ERD, identify its level, find its legend and read every relationship as two plain sentences.
Database courses around the world share a recurring moment. A student holds up a phone showing two diagrams of the same "sales management" problem. The first, taken from a textbook, has rectangles, diamonds and ovals, with the numbers 1 and N written on the connecting lines. The second, captured from an online video tutorial, has only rectangular boxes listing column names, joined by lines that end in small "crow's feet". The question is always the same: "Which one is the correct ERD?"
The short answer is that both may be correct. A database schema is a description of the structure of data, not the data itself. The same business domain can be expressed by entity relationship diagrams (ERDs) that look very different, because they use different notations, sit at different levels of abstraction or reflect different design choices. Answering the question properly requires three things that introductory materials often skip: what a schema is and how it differs from the diagram used to draw it; why the database community has lived with several ERD notations for about fifty years; and which conceptual misunderstandings lead students and professionals alike to read diagrams wrongly, draw them wrongly and then implement them wrongly.
The article uses one running example: an online academy with students, courses, instructors and enrollments. Alongside it are real, publicly available sample databases that you can download and inspect for yourself.
The article has seven sections. Section 1 defines a schema, separates it from an instance and presents the levels of schema. Section 2 untangles terminology: the word "schema" means different things in MySQL, PostgreSQL, Oracle and SQL Server. Section 3 reviews the history of ERD notations, from Bachman and Chen to IDEF1X and UML. Section 4 analyzes seven reasons why one problem can have many "versions" of an ERD. Section 5 learns from four real schemas: Sakila, WordPress, Chinook and Northwind. Section 6 clears up ten common misconceptions, and Section 7 proposes a seven-step routine for reading and drawing ERDs without confusion.
1. What is a database schema?
This section starts from the most basic definition, separates the schema from the data and then presents two ways of layering schemas: the ANSI/SPARC three-schema architecture and the three modeling levels used in design practice.
1.1. Schema and instance, the blueprint and the building
In the classic textbook by Elmasri and Navathe (2016), a database schema is the description of a database: which types of data exist, what attributes they have, how they relate to each other and which constraints they must satisfy. The schema is specified during design and rarely changes. By contrast, the actual data stored in the database at a particular moment is called the database instance or state; it changes every time someone inserts, updates or deletes a row.
A useful comparison: the schema is like the architectural drawing of an apartment building, while the instance is like the list of residents living there today. The drawing says that each apartment has a number of rooms, sits on one floor and that each floor belongs to one building. The list of residents changes every week as people move in and out. You do not redraw the plans because a new family has arrived.
Silberschatz et al. (2020) offer another comparison for programmers: the schema corresponds to the type declarations of variables in a program, while the instance corresponds to the values of those variables at a given moment. Applied to the online academy, the boundary between the two layers is very clear:
The schema says: there is a table
studentwithstudent_id,full_nameandemail; there is a tablecoursewithcourse_id,titleandfee; each enrollment links one student to one course on a specific date; email addresses must be unique.The instance says: this morning there are 1,284 students, 37 courses and 5,902 enrollments (illustrative figures). By the afternoon the numbers may already be different.
The distinction sounds obvious, but as Section 6 will show, many misconceptions start from mixing these two layers.
1.2. The ANSI/SPARC three-schema architecture, who sees what
In the mid-1970s, the study group on database management systems of the ANSI/X3/SPARC committee in the United States proposed an architectural framework whose influence is still felt today. The final report, edited by Tsichritzis and Klug (1978), distinguishes three kinds of schema, summarized in Table 1 with examples from the online academy.
The core goal of this architecture is data independence: changing storage at the internal level should not force changes to the conceptual schema, and changing the conceptual schema should, to some degree, not force changes to every application that uses the external views (Tsichritzis & Klug, 1978). This is why a database administrator (DBA) can add an index at midnight to speed up queries and the academy's mobile app still works normally the next morning.
One point deserves attention. In the ANSI/SPARC architecture, the word "conceptual" refers to the organization-wide schema. In today's design practice, "conceptual" usually refers to the first modeling level, before a relational model has even been chosen. The two uses are close but not identical, and that is the first source of confusion worth remembering.
1.3. Three modeling levels in practice, conceptual, logical and physical
When designing a new database, a development team usually goes through three steps, each producing a kind of schema for a different "audience" (Elmasri & Navathe, 2016). Figure 1 places the three levels side by side for the same business rule, "a student enrolls in a course".
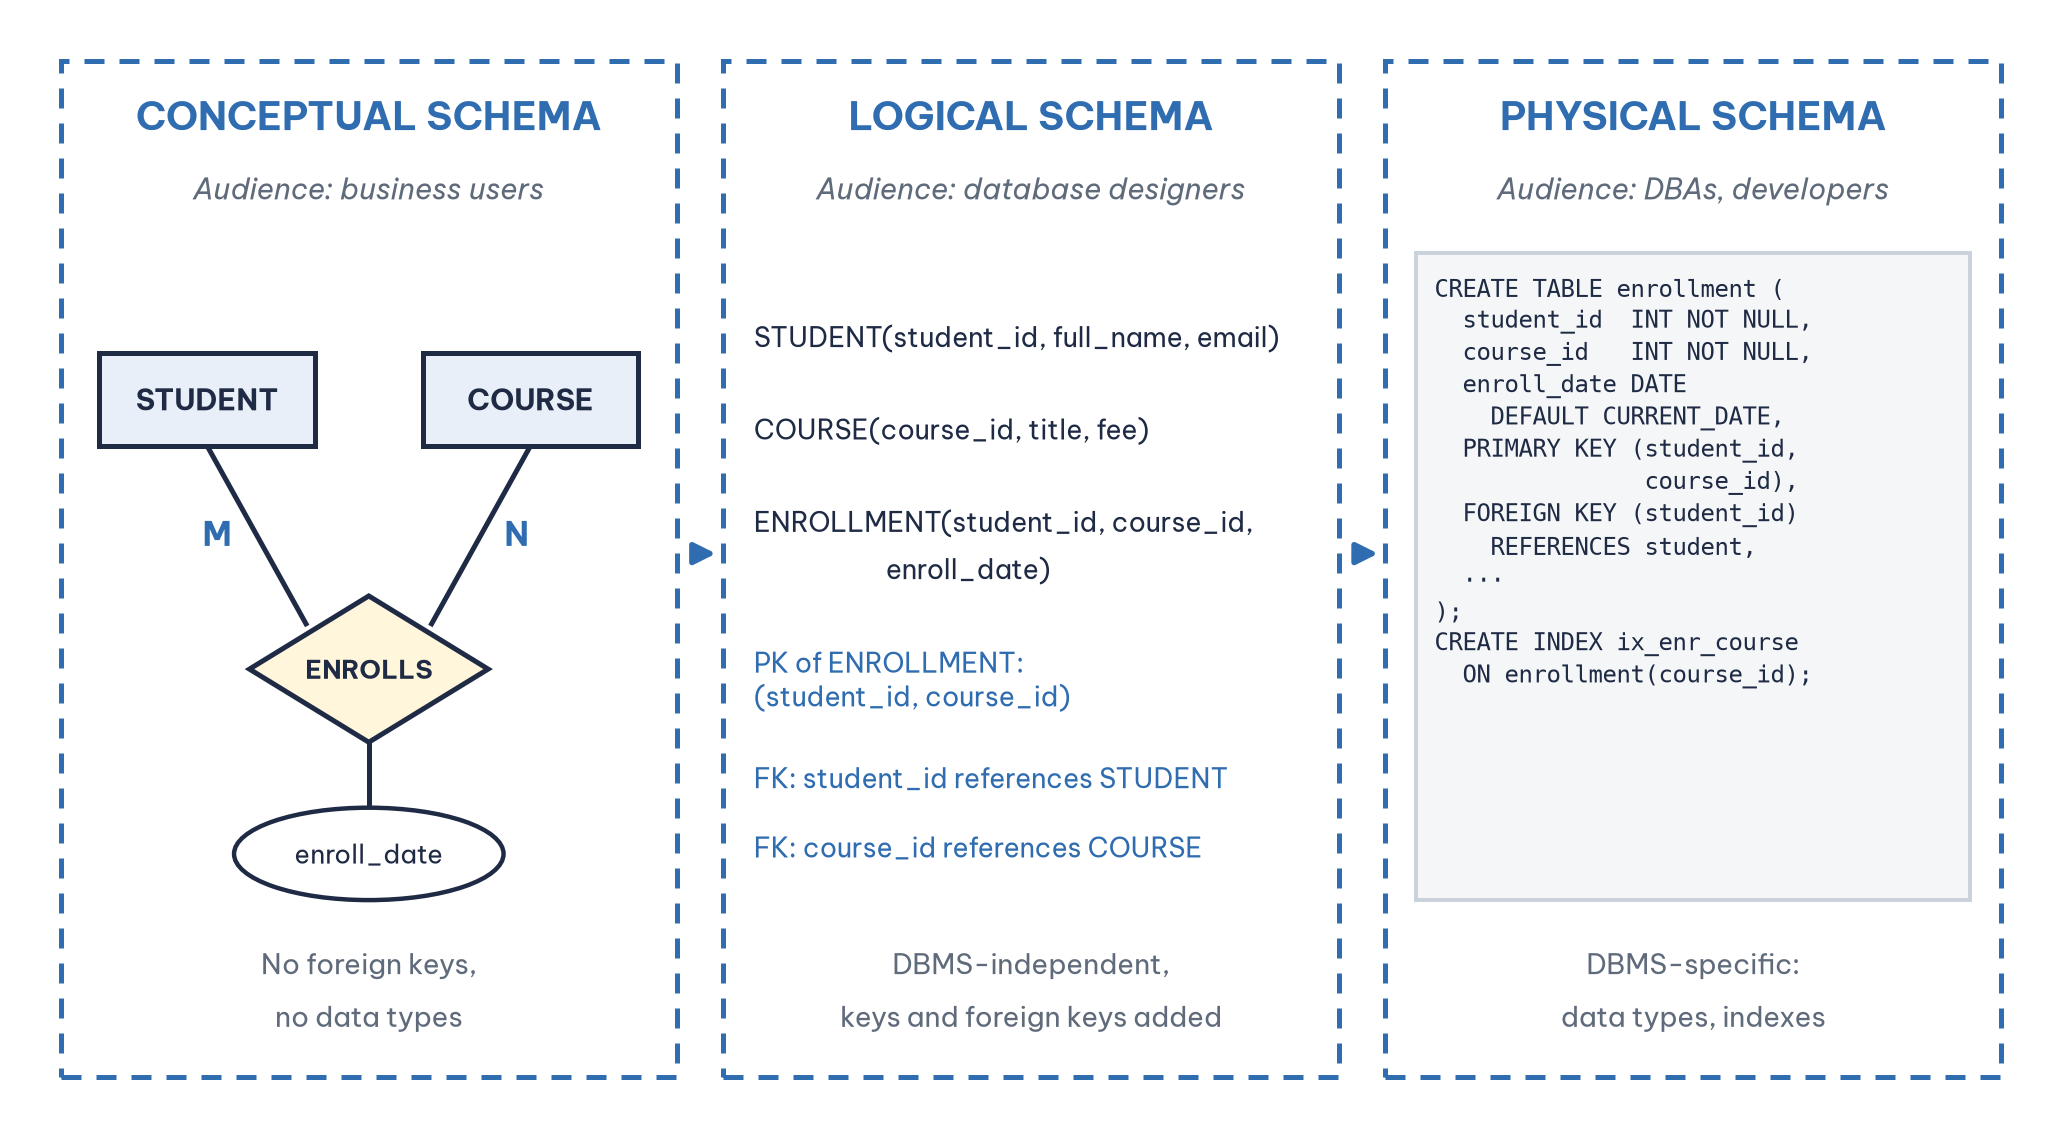
The conceptual schema describes the business world in language that non-technical people can check: "A student enrolls in a course; each enrollment has an enrollment date." At this level there are no foreign keys and no data types yet, and a many-to-many (M:N) relationship is drawn directly as a diamond. The most widely used tool at this level is the entity relationship model (ER model) of Chen (1976). Goelman and Song (2004) observe that since its introduction the ER model has been the dominant means of presenting and communicating schemas at the conceptual level, that is, independently of how they will later be implemented.
The logical schema translates the conceptual schema into a specific data model, usually the relational model of Codd (1970). Each relation is now written as RELATION_NAME(attribute_1, attribute_2, …), with a primary key and foreign keys, and the M:N relationship between Student and Course has become a relation of its own, ENROLLMENT. The logical schema is still independent of the database management system (DBMS): it holds for MySQL, PostgreSQL and SQL Server alike.
The physical schema is the version that "runs": CREATE TABLE statements with concrete data types (INT, VARCHAR(255), DATE), default values, indexes, partitions and naming conventions specific to each DBMS. This is what you see when you open MySQL Workbench or pgAdmin and click "Reverse Engineer".
The three levels do not replace each other; they are three views of the same design that serve three different conversations. A common mistake is to bring a physical diagram full of column names and data types to a meeting with the academic office to ask "is this enrollment process right?", or, the other way round, to hand a programmer a Chen diagram full of diamonds and say "go and build it".
2. One word "schema", four meanings in four DBMSs
Before discussing ERDs, a terminology knot needs untying. In theory, a schema is a description of structure. But when you type commands into a particular DBMS, the keyword SCHEMA takes on quite different operational meanings. Table 2 compares four popular systems.
Table 2 reveals something important: when a colleague says "I'll send you the schema", they might mean an ERD, a .sql file containing all the CREATE TABLE statements or the name of a PostgreSQL namespace. All three are "correct", but they cannot stand in for one another. Always ask: do you mean a schema in the design sense, or a schema as an object in the DBMS? The word also appears in data warehousing with a narrower meaning, a specific way of organizing tables, as in the star schema with its fact and dimension tables.
3. A little history, where do ERD notations come from?
The quickest way to understand why there are so many "versions" of ERDs is to look at the circumstances in which each one was born. Every notation was an answer to a problem of its time.
1969, Bachman's data structure diagrams. Before the relational model became widespread, network database systems such as General Electric's IDS already needed a way to draw data structures. Charles Bachman proposed data structure diagrams that used boxes and arrows to show record types and the one-to-many links between them (Bachman, 1969). This notation is regarded as the forerunner of the ERD. Interestingly, it did not allow a many-to-many link to be drawn directly but forced the designer to split it into two one-to-many links. The idea of "breaking M:N into a junction table", which students now learn in the relational model, already appears here.
1970, Codd's relational model. Codd (1970) proposed organizing data into relations in the mathematical sense: sets of tuples with the same structure. This is the theoretical foundation of every SQL DBMS today, but the paper did not propose any graphical notation.
1976, Chen's entity relationship model. Peter Chen published the ER model together with its own diagramming technique as a database design tool (Chen, 1976). The original notation uses rectangles for entity types, diamonds for relationship types and cardinalities such as 1, N and M written on the connecting lines. Chen aimed for a "unified view" that could be translated into the network, hierarchical or relational model. Precisely because it sits above the implementation models, Chen notation is best suited to the conceptual level.
Late 1970s to 1980s, crow's foot and Information Engineering. Gordon Everest (1976) introduced the "crow's foot" symbol (originally called an "inverted arrow") to represent the "many" side of a relationship. The symbol was later popularized by the Information Engineering methodology of James Martin and Clive Finkelstein, and it became the default in a great many CASE tools and modern drawing tools.
1990, Barker notation. Richard Barker developed a crow's foot variant for Oracle's CASE*Method, using solid and dashed line halves to distinguish mandatory from optional participation (Barker, 1990). If you have used Oracle SQL Developer Data Modeler, you have met this notation.
1993, IDEF1X. The U.S. National Institute of Standards and Technology issued IDEF1X as Federal Information Processing Standard FIPS PUB 184, a technique for building graphical information models for data administration and database design (National Institute of Standards and Technology [NIST], 1993). IDEF1X clearly distinguishes independent entities (square-cornered boxes) from dependent entities (round-cornered boxes); it also separates identifying relationships (solid lines) from non-identifying ones (dashed lines). Tools such as erwin Data Modeler support this notation.
1997 to today, UML. The Unified Modeling Language (UML) was not designed specifically for databases, but the UML class diagram is often used as an ERD, especially in object-oriented software projects. Cardinality is written as multiplicity, such as 1, 0..1, 0..* and 1..* (Object Management Group [OMG], 2017).
Song et al. (1995) collected and compared the popular ERD notations of their day and concluded that ERDs differ considerably in how they represent cardinality, participation constraints, higher-order relationships, specialization and even whether foreign keys appear on the ERD at all. In other words, the "diversity" that confuses students today was documented by researchers more than thirty years ago.
4. Why does one problem have many versions of its ERD?
Back to the student's question. There are at least seven reasons why two ERDs of the same business domain look different, and only one of them is "somebody drew it wrong". Each subsection below presents one reason.
4.1. Different notations, the same sentence in a different alphabet
Consider a very simple business rule of the academy: each course is taught by exactly one instructor; an instructor may teach zero, one or many courses. Figure 2 expresses that rule in four notations: Chen, extended Chen (min, max), crow's foot and a UML class diagram.
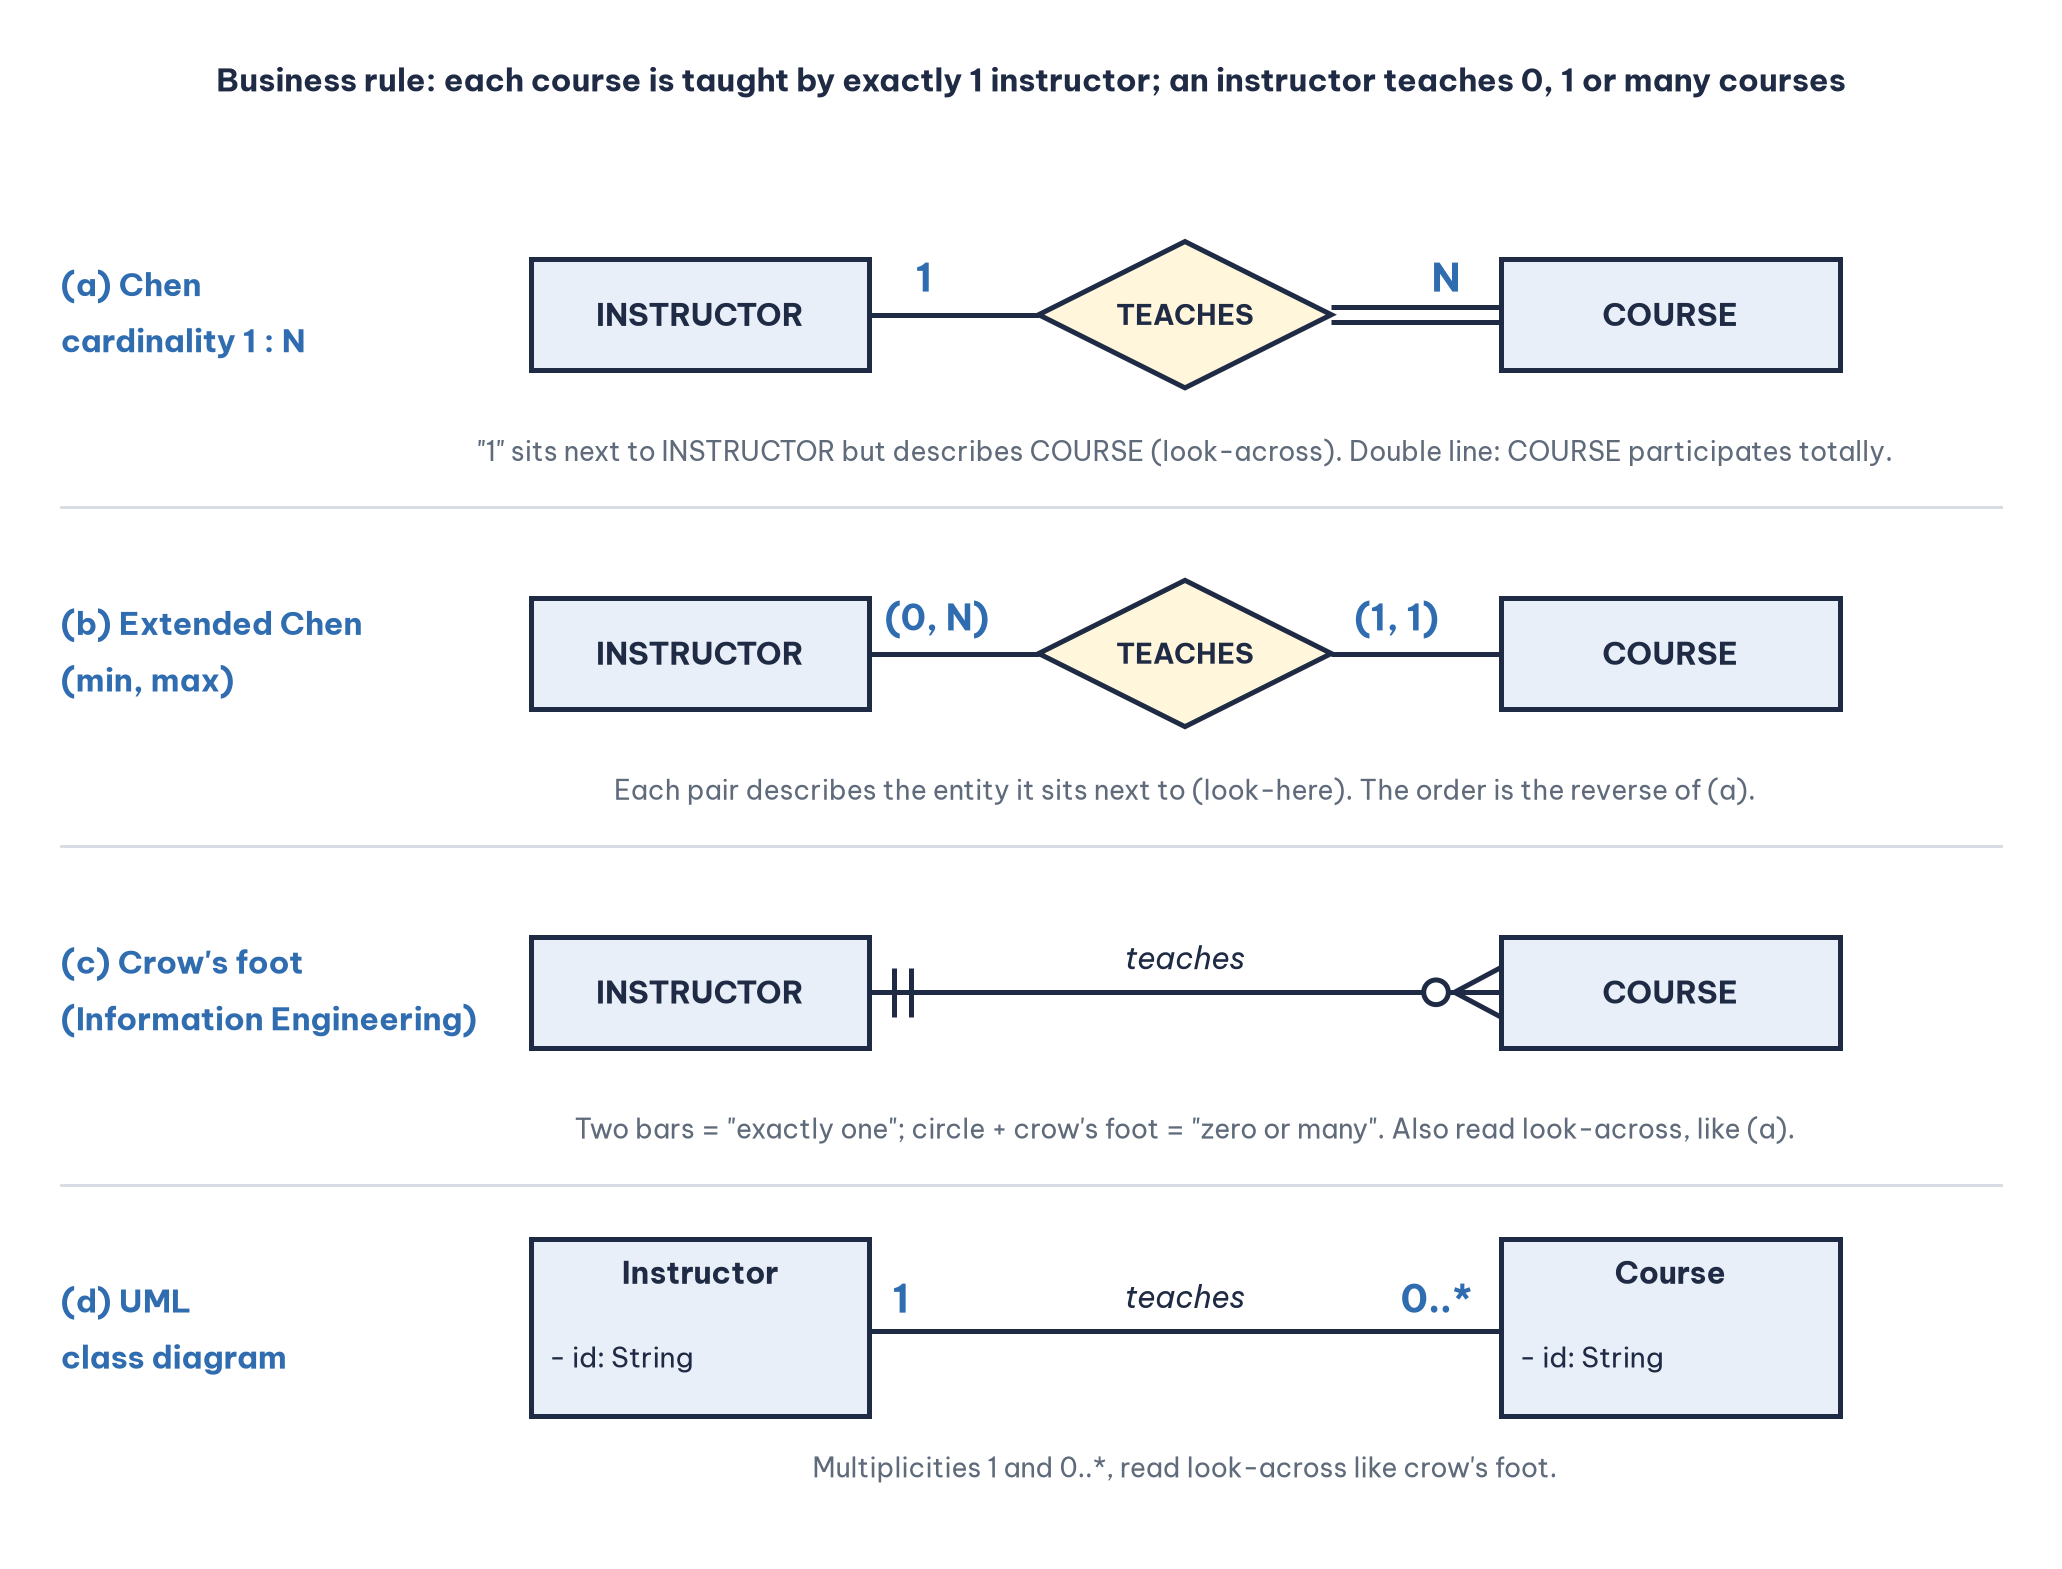
All four diagrams carry the same information content. They differ only in the "alphabet" used to write it down, much as the same sentence can be written in the Latin or the Cyrillic script. Table 3 summarizes the main differences between the notations you are most likely to meet.
Beyond these six there are many hybrid variants. Jukić (2025), for example, keeps Chen's diamonds for relationships but writes cardinality with crow's foot style symbols.
4.2. Different directions for reading cardinality, look-across and look-here
This is the most dangerous source of confusion, because it lets a reader understand a business rule exactly backwards while still believing they read it correctly.
Look again at Figure 2(a). In Chen notation the "1" is placed next to INSTRUCTOR, but it answers a question about COURSE: "How many instructors is one course linked to?" Answer: one. Likewise, the "N" next to COURSE answers the question "How many courses is one instructor linked to?". This reading is called look-across: the number at the far end describes the entity at this end. Crow's foot and UML are also read look-across.
Now look at Figure 2(b), the (min, max) notation used by Elmasri and Navathe (2016). The pair (0, N) next to INSTRUCTOR describes INSTRUCTOR itself: each instructor takes part in the TEACHES relationship at least 0 times and at most N times. The pair (1, 1) next to COURSE says each course takes part exactly once. This is look-here reading.
The consequence: if you copy the positions of the numbers from a Chen diagram into a (min, max) diagram without swapping them, you create a business rule that is the exact opposite: each instructor may teach only one course, while each course has many instructors. Comparative analyses of notations all treat the placement of cardinality as a fundamental difference between notations (Song et al., 1995). The practical advice: before reading any ERD, look for the legend. If there is no legend, ask the person who drew it.
4.3. Different levels of abstraction
The two diagrams in the opening story are actually not at the same level. The Chen diagram in the textbook is a conceptual schema; the box diagram with column names in the video is a logical or physical schema. Many people call both "ERDs", and in everyday conversation that is acceptable. But when comparing, compare like with like: a physical diagram always has extra junction tables, foreign keys and data types that a conceptual diagram does not. Seeing an extra ENROLLMENT table does not mean either diagram is wrong.
4.4. Different modeling choices, one problem with several correct answers
Database design is not a problem with a single right answer. For the same business domain, two good designers may produce two different schemas, both valid. Three common examples from the online academy:
Is an address an attribute or an entity? If you only need to print an address on an invoice, an
addressattribute is enough. If you need to count students by city or region, or if one student may have several addresses (home and work),ADDRESSshould be an entity of its own. The Sakila sample database takes the second route, with separateaddress,cityandcountrytables (Oracle, n.d.-c).Is enrollment a relationship or an entity? If an enrollment has only an enrollment date, drawing it as an M:N relationship with an attribute is enough. But if an enrollment has payments, certificates, grades and course reviews, it should become an associative entity so that other relationships can attach to it.
Do instructors and students share a USER entity? If one person can both study and teach, a specialization (USER as the superclass, STUDENT and INSTRUCTOR as subclasses) may be more appropriate than two separate entities.
Song and Froehlich (1994), in their guide to teaching ER modeling to beginners, deliberately presented a sample problem with a preferred solution and a series of flawed diagrams to analyze. That approach implicitly acknowledges that between "right" and "wrong" lies a zone of "correct but not fitting the requirements". When grading, the question should be does this design capture the stated business rules correctly? rather than does this design look like the model answer?
4.5. Different drawing tools
Every tool imposes a default notation and some limits of its own. Three common groups of tools show this clearly:
MySQL Workbench draws physical diagrams in crow's foot style, generated directly from
CREATE TABLEstatements.Mermaid, a text-based diagramming library built into GitHub, GitLab and many note-taking tools, uses crow's foot notation for ER diagrams, with syntax such as
COURSE }o--|| INSTRUCTOR : "is taught by"(Mermaid, n.d.).draw.io, Lucidchart and Visio offer several symbol sets, so a person can accidentally mix Chen and crow's foot on the same diagram.
So when you put a screenshot from a tool next to a diagram from a textbook, differences in form are to be expected.
4.6. Different purposes and readers
Moody (2009) points out that in software engineering, notation designers tend to put their effort into semantics, while visual form is often neglected and rarely has a clear scientific basis. As a result, each notation is strongest with a particular group of readers. A Chen diagram, with diamonds named by verbs, reads almost like a sentence ("Instructor teaches Course"), which makes it well suited to conversations with business people. A crow's foot diagram is compact and has room to list attributes, which suits programmers. UML suits development teams already familiar with class diagrams. Choosing a notation means choosing a common language with your audience, not choosing a side.
4.7. Different model versions, basic ER and enhanced ER
Chen's original ER model (1976) had no notion of superclasses and subclasses. The enhanced ER (EER) model added specialization, generalization, disjoint or overlapping constraints and total or partial constraints (Elmasri & Navathe, 2016). If your textbook teaches EER while online materials use only basic ER, you will see triangles or circles marked "d" or "o" on one side and not on the other.
5. Learning from real schemas
Theory is much easier to remember once you open a real database and look inside. This section analyzes four publicly available examples that can be downloaded for free, each illustrating a different aspect of schemas.
5.1. Sakila, junction tables and why entities do not equal tables
Sakila is a sample database developed by Mike Hillyer, a former member of the MySQL AB documentation team, that models a DVD rental store; the first official version was released in March 2006 (Oracle, n.d.-c). The distribution includes sakila-schema.sql, which contains all the statements that create the structure (tables, views, stored procedures and triggers), sakila-data.sql with the data itself and sakila.mwb for opening in MySQL Workbench. This is a very clear example of schema and instance being split into two separate files: you can create the schema first and load the data later, or load a completely different data set into the same schema.
Look at the relationship between actors and films. An actor appears in many films; a film has many actors. At the conceptual level this is an M:N relationship called "appears in". At the physical level, Sakila creates a table film_actor with actor_id, film_id and last_update, whose primary key is composed of the first two columns, each of which is also a foreign key. Figure 3 redraws this part of the schema.
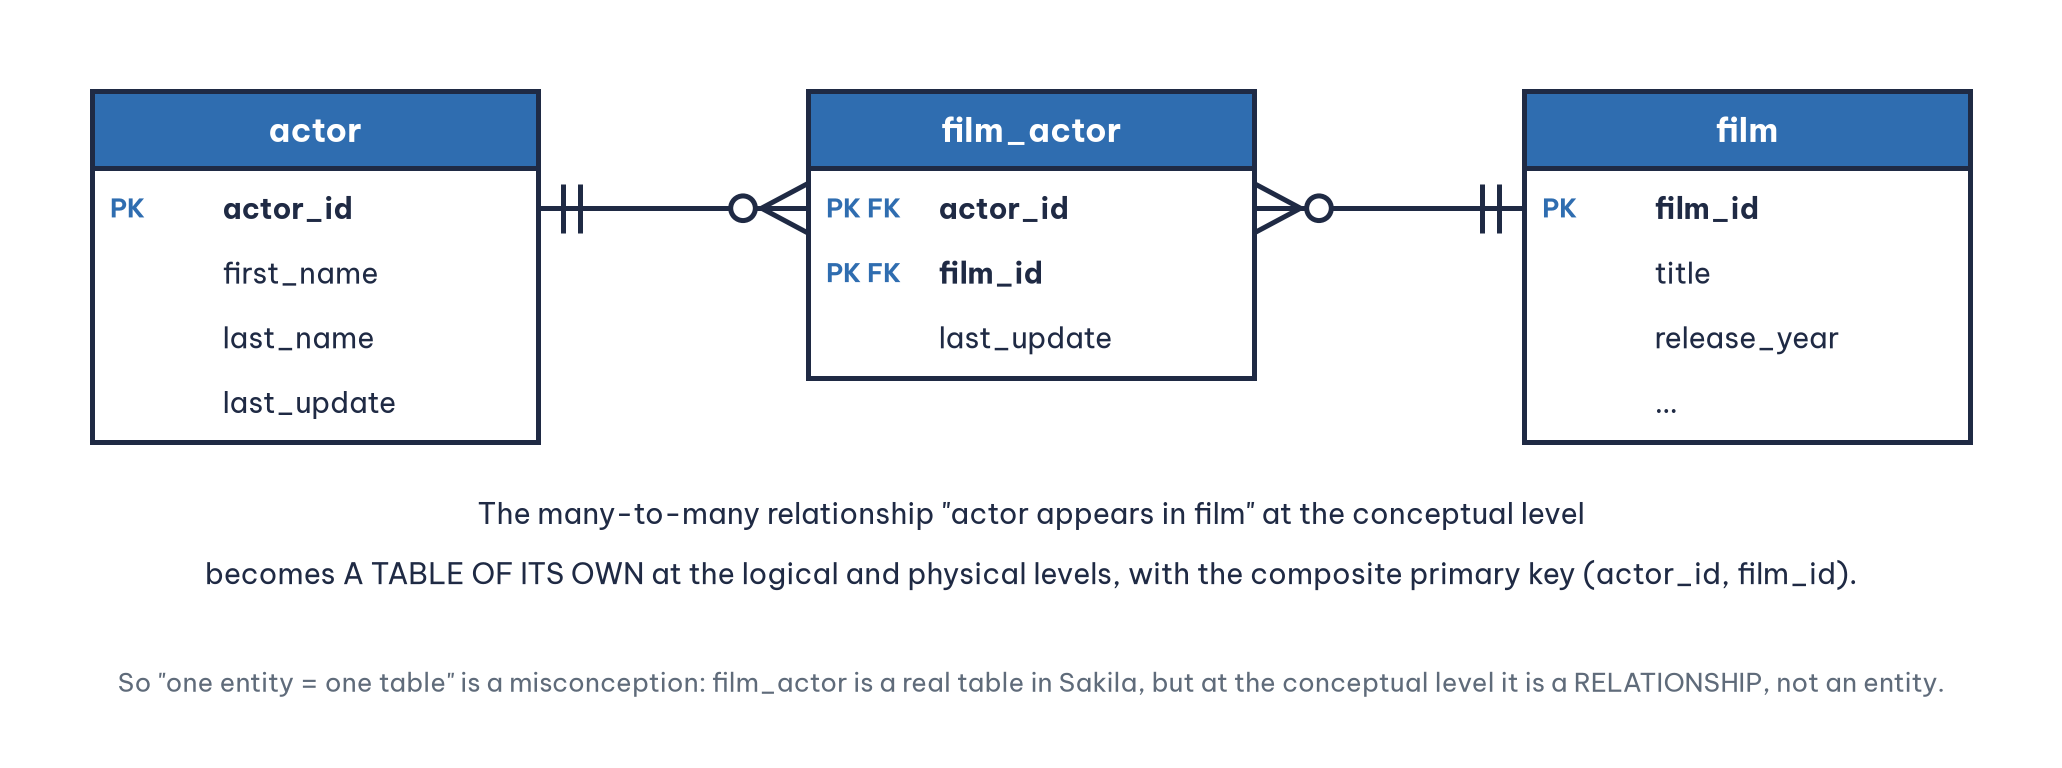
The same happens with film_category. If you count "one entity, one table", you will never explain why Sakila's physical schema has more tables than its conceptual model has entities. Try redrawing Sakila's conceptual schema in Chen notation and you will find yourself "folding" film_actor and film_category back into diamonds.
5.2. WordPress, when foreign keys exist only on paper
WordPress, the content management system behind a very large number of websites, is an interesting example of the gap between the logical and physical schema. Three features of the WordPress schema are worth a close look.
First, according to the database description in the WordPress Codex, the wp_posts table is the core of WordPress data, and besides posts it also holds pages and navigation menu items (WordPress.org, n.d.-a). In other words, one physical table (wp_posts) carries several distinct business concepts, told apart by the post_type column. This is a deliberate design choice for flexibility, not a mistake; but if you draw a conceptual ERD for WordPress, you will have separate entities such as POST, PAGE, MENU ITEM and ATTACHMENT and then have to explain why they are merged into a single table.
Second, WordPress uses "meta" tables such as wp_postmeta (with meta_id, post_id, meta_key and meta_value) to store additional information that plugins can freely add. This is a variant of the entity attribute value (EAV) pattern: instead of adding a new column to the schema every time a new attribute is needed, the system adds new rows to the meta table. The physical schema barely changes, but the "real schema" of the data keeps growing. It shows clearly that the declared schema and the structure of data actually in use can drift apart.
Third, and most interesting: the database description page for WordPress version 2.8 states that in a standard installation no integrity constraints are enforced between tables, for example between posts and comments (WordPress.org, n.d.-b). In the table descriptions, the post_id column of wp_postmeta is noted as referring to wp_posts.ID, but it is declared only as an ordinary index. So if you draw an ERD from the documentation, you will have a line between the two tables; if you use a tool to reverse engineer the database directly, those lines may disappear, because the tool sees only declared foreign keys. Both diagrams reflect a truth: one shows the design intent (logical), the other shows what the DBMS actually checks (physical).
5.3. Chinook and Northwind, two classic practice grounds
The next two sample databases are used very widely in SQL teaching, and each illustrates a notable structure.
Chinook is a sample database that models a digital music store, with tables for artists, albums, tracks, customers, invoices and employees; its repository provides schema creation scripts for six DBMSs: DB2, MySQL, Oracle, PostgreSQL, SQL Server and SQLite (Rocha, n.d.). Because the same logical schema is implemented on several systems, Chinook is an ideal place to watch one logical schema produce several physical schemas with different data types and conventions. One detail stands out: the employee table has a ReportsTo column that refers back to the same table, a recursive relationship (one employee reports to another). In Chen notation this is a diamond connected twice to the same rectangle, each branch carrying a role ("manager", "subordinate").
Northwind is a sample database released by Microsoft in the days of Access and early SQL Server, modeling a specialty food import and export company; it is still kept in Microsoft's official sample code repository on GitHub (Microsoft, n.d.-b). Northwind's Order Details table is the classic example of an M:N relationship with attributes: an order has many products, a product appears in many orders and each (order, product) pair has its own quantity, unit price and discount.
5.4. Lessons from the four examples
Each sample database leaves its own lesson about schemas. Table 4 gathers the four lessons for easy reference when you open these schemas yourself.
6. Ten common misconceptions about schemas and ERDs
This section gathers the misconceptions that turn up most often in student assignments, project reviews and work with companies. Each comes with the correct understanding and an example.
6.1. "Relational databases are called that because the tables have relationships"
This may be the most widespread misconception, partly because "relation" and "relationship" are so close in English (and in many other languages the two are translated by the same word). In fact, "relational" comes from the mathematical concept of a relation that Codd (1970) used: a relation is a set of tuples, which is what we now call a table. A database with a single table is still a relational database.
A relationship between entities, on the other hand, is a concept of the ER model (Chen, 1976). In the relational model, the connection between two tables is expressed indirectly through foreign key values, not as a separate object. To avoid confusion, it pays to use "relation" strictly for a table and "relationship" strictly for an association between entities.
6.2. "The ERD is the database schema"
An ERD is one graphical representation of a schema, usually at the conceptual or logical level. A schema is a description of structure and can exist as a diagram, as text such as STUDENT(student_id, full_name, email), as DDL statements or as metadata in the DBMS's system catalog. A complete physical schema also includes indexes, triggers and access privileges, which an ERD almost never shows. In short: every ERD describes a schema, but not every schema is an ERD.
6.3. "Each entity maps to exactly one table"
As Sakila showed, the rules for mapping ER to relations are much more involved. The following five cases all break the "one entity, one table" formula:
An M:N relationship produces an additional table (the junction table).
A multivalued attribute (a student with several phone numbers) produces an additional table.
Specialization can produce one table for the whole hierarchy, one table per subclass or one table per class, depending on the strategy (Elmasri & Navathe, 2016).
A one-to-one relationship can lead to two entities being merged into one table.
In the opposite direction, as WordPress showed, several business concepts can share one physical table.
6.4. "Foreign keys must appear on the conceptual ERD"
A foreign key is an implementation mechanism of the relational model, not a business concept. On a conceptual ERD in Chen notation, the connection is already shown by the diamond and its lines; adding an instructor_id column to the COURSE entity is redundant and many textbooks treat it as an error. Song et al. (1995) even use "does the notation model foreign keys at the ERD level?" as one of the criteria for classifying notations, which shows this is a difference between schools rather than a universal standard. On a logical or physical crow's foot diagram the opposite holds: listing foreign keys is normal and useful.
A safe rule: at the conceptual level, do not draw foreign keys; at the logical and physical levels, draw them all.
6.5. "Cardinality and participation are the same thing"
Cardinality in the narrow sense (cardinality ratio), or maximum cardinality, answers the question at most how many?: 1 or N. Participation, or minimum cardinality, answers at least how many?: 0 (partial, optional participation) or 1 (total, mandatory participation). Chen-style notation as taught in most textbooks keeps the two pieces of information apart: 1 and N for cardinality, a double line for total participation. The (min, max) and crow's foot notations combine both into one symbol.
For example, "an instructor teaches many courses" speaks only to maximum cardinality. The next question must be: can a newly hired instructor who teaches no course yet exist in the system? If so, the instructor's participation is partial (min = 0). Skip this question and you may put a NOT NULL constraint in the wrong place, so that the system refuses to save a new instructor's record.
6.6. "The word cardinality has only one meaning"
In database theory the word cardinality is used for at least three different things:
Relationship cardinality in the ER model (1:1, 1:N, M:N).
The cardinality of a relation in the relational model: the number of tuples (rows) the table holds, in the precise mathematical sense of the cardinality of a set.
Column cardinality in query optimization: the number of distinct values in a column, used to decide whether an index is worthwhile (a
gendercolumn has low cardinality, anemailcolumn has high cardinality).
Similarly, degree means both the number of entity types taking part in a relationship (binary, ternary) and the number of attributes of a relation. When reading any material, establish the context before interpreting the term.
6.7. "A ternary relationship can always be split into three binary ones"
Suppose the academy records: instructor I teaches course C in room R. If you split this into three binary relationships (I–C, C–R, I–R), you may reconstruct triples that never existed. For example: Ms. A teaches the SQL course, Ms. A has used room 101 and the SQL course has been held in room 101, yet Ms. A has never taught SQL in room 101 (perhaps Mr. B is the one who teaches SQL there). Kent (1983), in his well-known guide to normal forms, analyzed such situations in detail in connection with fifth normal form. Whether a ternary relationship can be decomposed depends on the specific business constraints; it is not a default rule.
6.8. "A diagram generated by a tool is the system's official ERD"
When you click "Reverse Engineer" in MySQL Workbench or DBeaver, the tool reads the system catalog and draws what is declared there: tables, columns, data types, primary keys and foreign keys. The result is a physical schema diagram, very useful but not a conceptual schema. It does not tell you the business names of relationships ("teaches", "enrolls in"), cannot tell junction tables from real entities and, as the WordPress example showed, may be missing connections that were never declared as foreign keys.
6.9. "NoSQL is schemaless, so there is no need to design a schema"
Document databases such as MongoDB do not force you to declare a structure before writing data. That does not mean the data has no structure. The schema simply moves from write time to read time (schema-on-read): the application code that reads the data still implicitly assumes that every "student" document has an email field. If nobody designs and documents that implicit schema, the team will discover it in the most painful way: when a document missing a field crashes the application. WordPress's EAV pattern is a "schemaless" design inside a relational DBMS, and it carries exactly the same strengths and weaknesses.
6.10. "The more modern notation is the more correct one"
Crow's foot is more common in tools and UML is more common in software, but no notation is "more correct" than another. They have different expressive power: for example, Chen notation represents a ternary relationship very naturally as one diamond connected to three entities, while many crow's foot variants support only binary relationships and force you to turn a ternary relationship into an associative entity (Song et al., 1995). Choose the notation that fits the problem and the readers; above all, use it consistently within a document and include a legend.
7. A seven-step routine for reading and drawing ERDs without confusion
Drawing on the analysis above, here is a routine that works both when guiding students through projects and when reviewing designs for companies. The seven steps run from identifying the diagram to checking it against the running system.
Step 1. Identify the level of the diagram. Before reading details, ask: is this a conceptual, logical or physical diagram? Are there data types? Foreign keys? Junction tables?
Step 2. Find the legend and identify the notation. Chen, (min, max), crow's foot, Barker, IDEF1X or UML? Above all, is cardinality read look-across or look-here?
Step 3. Read every relationship as two plain sentences. For each line, write out two sentences, one in each direction: "Each course is taught by exactly one instructor." and "Each instructor teaches zero or more courses." If either sentence sounds absurd for the business, either the diagram is wrong or you are reading it in the wrong direction.
Step 4. Check both the minimum and the maximum. Every end of a relationship must answer both "at least how many?" and "at most how many?".
Step 5. Look for M:N relationships with attributes and consider associative entities. Any M:N relationship that has attributes (an enrollment date, a grade, a quantity) is a candidate for becoming an entity of its own at the logical level.
Step 6. Test with sample data. Take five to ten rows of made-up data (or real, anonymized data) and try to "place" them in the schema. Edge cases such as a student with no enrollments, a course with no instructor yet or an instructor who is also a student will surface very quickly.
Step 7. Compare with the physical schema. If the system is already running, compare the design diagram with the reverse-engineered result. Relationships that exist in the design but have no matching foreign key should be clearly noted: are they enforced in the application layer, or simply forgotten?
Conclusion
Back to the student's question: "Which one is the correct ERD?" We can now answer more fully. The two diagrams may both be correct, because they use two different notations (Chen and crow's foot), sit at two different levels (conceptual and physical) and may reflect different design choices for the same business domain. A diagram is truly wrong only when it misstates a business rule, contradicts the very notation it claims to use or mixes levels of abstraction so that readers cannot understand it correctly.
Three messages are worth carrying away. A schema is a description of structure, not data, and it can be represented at several levels: conceptual, logical and physical. The diversity of ERDs is a historical legacy with good reasons behind it, from Bachman, Chen and Everest to IDEF1X and UML, so anyone who works with databases needs to learn to read several notations and to choose one to write in consistently. Finally, many misconceptions come from terminology: relation and relationship, schema in theory and schema in a DBMS, cardinality and participation. Calling things by their right names is the first step toward designing them right.
An effective self-test is to pick one of the four sample databases in Section 5, redraw its conceptual schema in two different notations and then ask a friend to read each one and write down the business rules. If both versions yield the same set of rules, you truly understand the schema rather than having merely memorized the shapes.
References
Bachman, C. W. (1969). Data structure diagrams. ACM SIGMIS Database: The DATABASE for Advances in Information Systems, 1(2), 4–10. https://doi.org/10.1145/1017466.1017467
Barker, R. (1990). CASE*Method: Entity relationship modelling. Addison-Wesley. https://www.amazon.com/s?k=CASE+Method+Entity+Relationship+Modelling+Barker&i=stripbooks
Chen, P. P.-S. (1976). The entity-relationship model: Toward a unified view of data. ACM Transactions on Database Systems, 1(1), 9–36. https://doi.org/10.1145/320434.320440
Codd, E. F. (1970). A relational model of data for large shared data banks. Communications of the ACM, 13(6), 377–387. https://doi.org/10.1145/362384.362685
Elmasri, R., & Navathe, S. B. (2016). Fundamentals of database systems (7th ed.). Pearson. https://www.pearson.com/en-us/subject-catalog/p/fundamentals-of-database-systems/P200000003546/9780137502523
Everest, G. C. (1976). Basic data structure models explained with a common example. In Proceedings of the Fifth Texas Conference on Computing Systems. IEEE Computer Society.
Goelman, D., & Song, I.-Y. (2004). Entity-relationship modeling re-revisited. In P. Atzeni, W. Chu, H. Lu, S. Zhou, & T.-W. Ling (Eds.), Conceptual modeling – ER 2004 (Lecture Notes in Computer Science, Vol. 3288, pp. 43–54). Springer. https://doi.org/10.1007/978-3-540-30464-7_5
Jukić, N. (2025). Database systems: Introduction to databases and data warehouses (3rd ed.). Prospect Press. https://www.prospectpressvt.com/textbooks/jukic-database-systems-introduction-to-databases-and-data-warehouses-3-0
Kent, W. (1983). A simple guide to five normal forms in relational database theory. Communications of the ACM, 26(2), 120–125. https://doi.org/10.1145/358024.358054
Mermaid. (n.d.). Entity relationship diagrams. Retrieved November 11, 2026, from https://mermaid.js.org/syntax/entityRelationshipDiagram.html
Microsoft. (n.d.-a). Create a database schema. Microsoft Learn. Retrieved November 11, 2026, from https://learn.microsoft.com/en-us/sql/relational-databases/security/authentication-access/create-a-database-schema
Microsoft. (n.d.-b). Northwind and pubs sample databases for Microsoft SQL Server [Source code]. GitHub. Retrieved November 11, 2026, from https://github.com/microsoft/sql-server-samples/tree/master/samples/databases/northwind-pubs
Moody, D. L. (2009). The "physics" of notations: Toward a scientific basis for constructing visual notations in software engineering. IEEE Transactions on Software Engineering, 35(6), 756–779. https://doi.org/10.1109/TSE.2009.67
National Institute of Standards and Technology. (1993). Integration definition for information modeling (IDEF1X) (Federal Information Processing Standards Publication 184). https://nvlpubs.nist.gov/nistpubs/Legacy/FIPS/fipspub184.pdf
Object Management Group. (2017). OMG Unified Modeling Language (OMG UML) (Version 2.5.1). https://www.omg.org/spec/UML/2.5.1
Oracle. (n.d.-a). CREATE DATABASE statement. In MySQL 8.4 reference manual. Retrieved November 11, 2026, from https://dev.mysql.com/doc/refman/8.4/en/create-database.html
Oracle. (n.d.-b). Managing schema objects. In Oracle Database 2 day DBA 11g release 2 (11.2). Retrieved November 11, 2026, from https://docs.oracle.com/cd/E29597_01/server.1111/e10897/schema.htm
Oracle. (n.d.-c). Sakila sample database. MySQL Documentation. Retrieved November 11, 2026, from https://dev.mysql.com/doc/sakila/en/
PostgreSQL Global Development Group. (n.d.). Schemas. In PostgreSQL documentation. Retrieved November 11, 2026, from https://www.postgresql.org/docs/current/ddl-schemas.html
Rocha, L. (n.d.). Chinook database [Source code]. GitHub. Retrieved November 11, 2026, from https://github.com/lerocha/chinook-database
Silberschatz, A., Korth, H. F., & Sudarshan, S. (2020). Database system concepts (7th ed.). McGraw-Hill Education. https://www.db-book.com/
Song, I.-Y., Evans, M., & Park, E. K. (1995). A comparative analysis of entity-relationship diagrams. Journal of Computer and Software Engineering, 3(4), 427–459. https://www.cin.ufpe.br/~in1008/aulas/A%20Comparative%20Analysis%20of%20Entity-Relationship%20Diagrams.pdf
Song, I.-Y., & Froehlich, K. (1994). Entity-relationship modeling. IEEE Potentials, 13(5), 29–34. https://doi.org/10.1109/45.464652
Tsichritzis, D., & Klug, A. (1978). The ANSI/X3/SPARC DBMS framework report of the study group on database management systems. Information Systems, 3(3), 173–191. https://doi.org/10.1016/0306-4379(78)90001-790001-7)
WordPress.org. (n.d.-a). Database description. WordPress Codex. Retrieved November 11, 2026, from https://codex.wordpress.org/Database_Description
WordPress.org. (n.d.-b). Database description/2.8. WordPress Codex. Retrieved November 11, 2026, from https://codex.wordpress.org/Database_Description/2.8
Discussion about this post