Measuring Data Quality: Six Dimensions and a Dashboard
Six quality dimensions, a SQL quality dashboard, the right cleaning order and the governance that keeps data from decaying again


Key takeaways
Data quality means fitness for a particular use, not just accuracy, so "good enough" must be set by purpose.
Six dimensions can each be measured with a query: accuracy, completeness, consistency, uniqueness, timeliness and conformity.
A quality dashboard turns each check into a count of violating rows; in the worked example only 56.4% of 500 sign-ups pass every check.
Adding up errors gives the wrong answer: duplicates live in the relationship between rows, so count clean rows directly and measure uniqueness separately.
Standardize before deduplicating, and treat quality as an operating metric with owners, a catalog, access controls and datasheets.
Sen Vang Mart, a hypothetical chain of mini-supermarkets, launches a mobile app for customers to sign up as members. After the first week, 500 sign-ups have been loaded straight into a staging table with no constraints. The marketing team wants to send a welcome offer by email and text message right away. Before sending, an analyst runs a few simple checks and finds that only 282 sign-ups, or 56.4%, have no errors at all. Nearly half of the rest are missing a date of birth, have a wrong phone number or email address, or are the same person signing up twice.
Nha Vui Home, a hypothetical furniture retailer, meets the same problem from another direction. Its systems report 30 customers, but reading row by row reveals only 21 people: one customer appears three times across three systems, and six others appear twice each. Every per-customer metric, such as average spend or repeat rate, is wrong as a result, and nobody notices because the reports still run normally.
The two cases show that the question "is our data good?" has no general answer; it has to be measured. This article has five sections. Section 1 defines data quality and six dimensions for measuring it. Section 2 builds a quality dashboard on the 500 sign-ups. Section 3 shows why adding up errors gives the wrong number. Section 4 sets out the right order for cleaning. Section 5 discusses data governance, so that quality does not decay again after cleaning.
1. Data quality and six dimensions
Data quality is the degree to which data is fit for the purposes of its users, not merely its accuracy (Wang & Strong, 1996). A customer table with no email addresses is perfectly good for forecasting demand by region but useless for a personalized email campaign. Wang and Strong (1996) surveyed data consumers themselves and grouped the dimensions of quality into four categories: intrinsic (accuracy, objectivity), contextual (completeness, timeliness, relevance), representational (interpretability, consistency) and accessibility. Jukić (2025) condenses them into six dimensions that can be measured with queries, as in Table 1.
Each dimension in Table 1 answers a different question and needs a different check; a dataset can be good on one dimension and poor on another. The last column is a reminder that each dimension breaks a different kind of application, so "good enough" must be set by purpose: a birthday program needs completeness of birth dates, while counting customers needs uniqueness.
2. A quality dashboard
Data created inside a well-constrained database is usually close to clean: no negative prices, no promotions that end before they start. Data arriving from outside is another matter, and 500 sign-ups from an app are a typical case of a new system being connected to an old one. An effective way to measure it is to build a quality dashboard: each row is a check, written as a query that counts violating rows, and the queries are combined with UNION ALL. Figure 1 shows the results of nine checks.
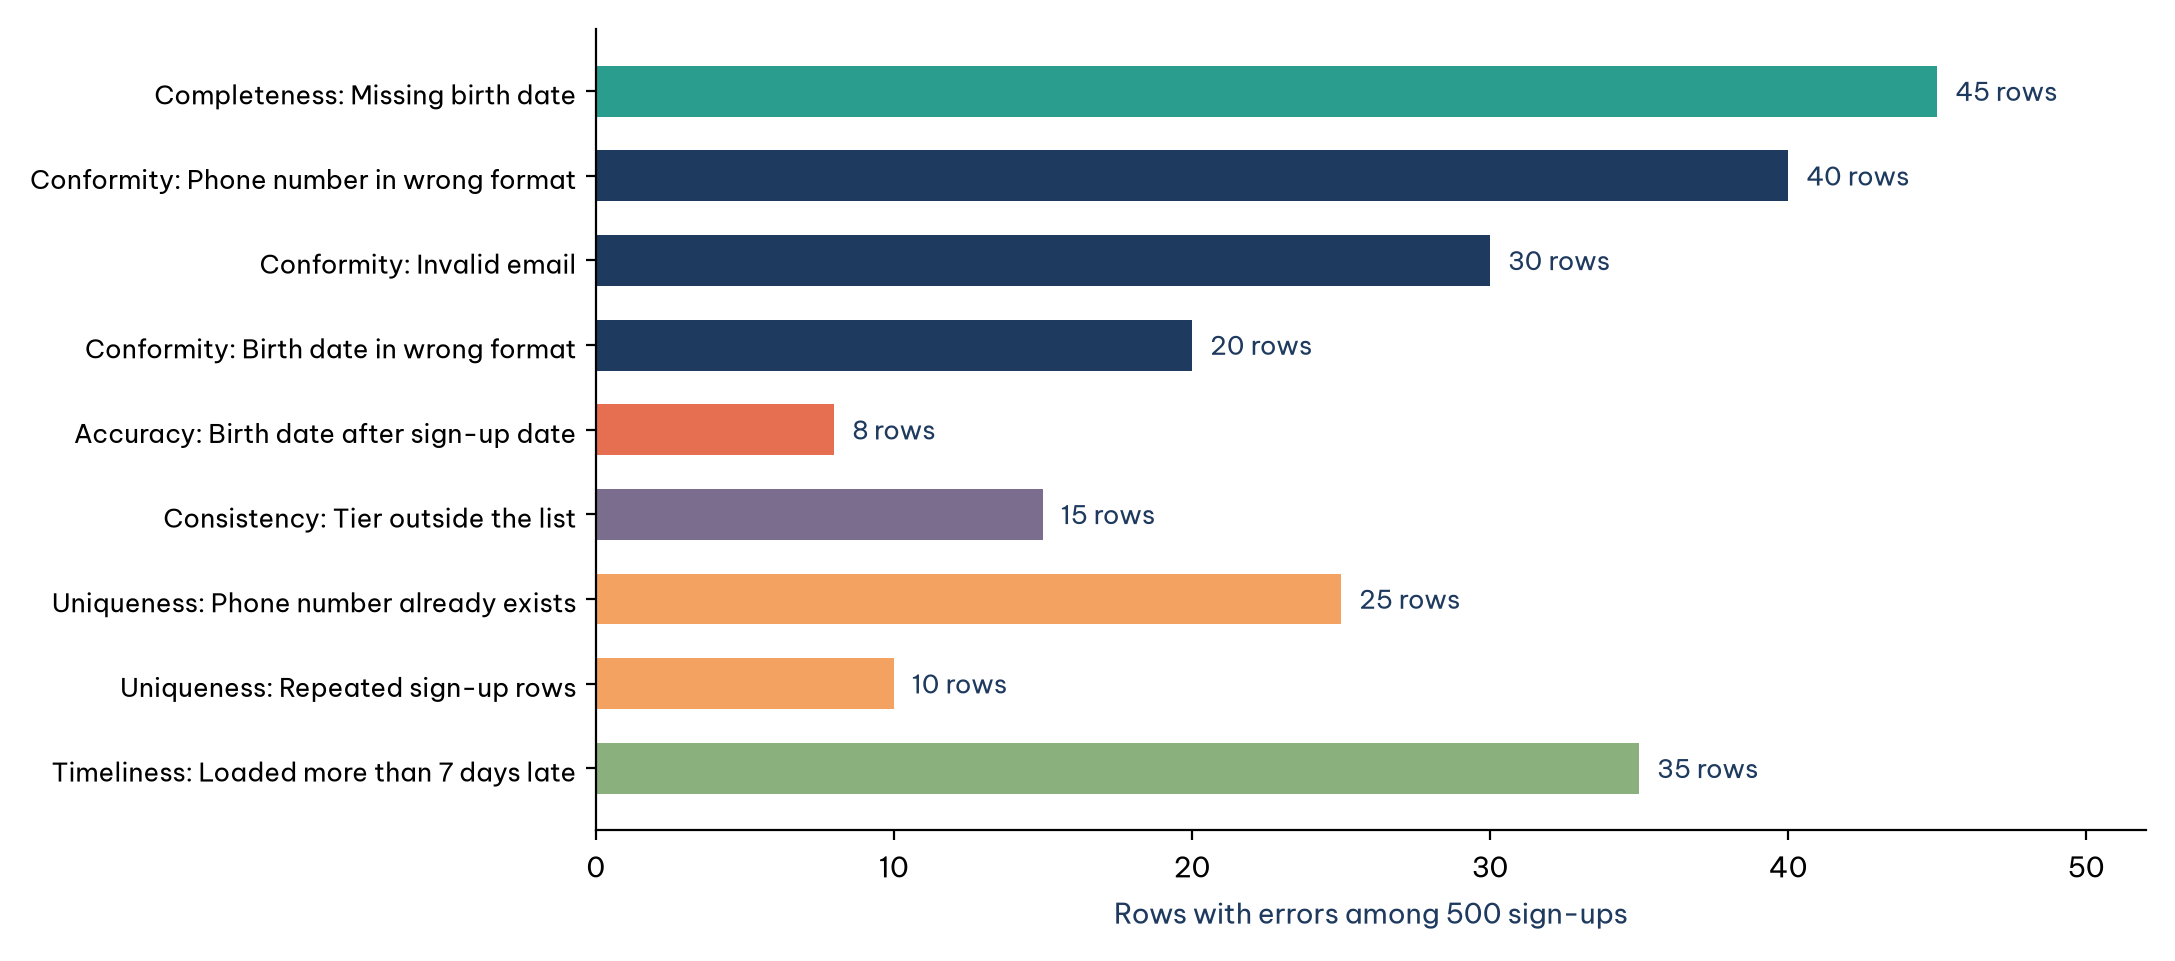
Figure 1 shows errors spread across all six dimensions rather than concentrated in one. Conformity has the most errors, 90 rows across three checks, mostly because the app's input fields do not validate formats. Accuracy errors are the fewest, 8 rows with a birth date after the sign-up date, but they are the hardest to fix because there is no way to know the true birth date. The 35 rows loaded more than seven days late mean that the welcome offer reaches those customers after they have forgotten signing up.
Quality checks are not only for outside data. Even in the official customer table, which passes every constraint, a duplicate check finds two pairs of customers sharing a phone number. It might be a couple sharing one number, or one person who signed up twice. The schema does not put a unique constraint on phone numbers, and should not, because the first case is legitimate. Data quality therefore cannot be handed entirely to constraints: part of it is business judgment that needs a person to review.
3. Why adding up errors gives the wrong number
The nine figures in Figure 1 add up to 228 errors. Another query that directly counts rows violating no check returns 282 clean rows, meaning 218 rows have errors. Table 2 sets the numbers side by side.
The difference of 10 in Table 2 is not a rounding error: it is exactly the 10 repeated sign-up rows. A duplicate does not belong to any one row but to the relationship between two rows, so no row-by-row check catches it; each row in a duplicate pair looks perfectly valid on its own. That is why uniqueness needs its own checks, such as grouping by phone number or matching against another table.
Table 2 holds a second lesson: total errors and rows with errors answer two different questions. A row can both lack a birth date and have a wrong email, so summed errors are usually larger than the number of rows with errors; duplicates pull the other way. To know "how many customers can receive the welcome offer", count clean rows directly instead of inferring it from total errors.
4. The right cleaning order
Return to Nha Vui Home and its 30 records gathered from three systems: the in-store point-of-sale software, the website and the customer service call center. A duplicate check on phone numbers reports 20 distinct numbers, but the true figure is lower. The reason lies in the number "+447700900101": it belongs to the customer who appears three times, written in international format in one system, while the other two record it as "07700900101". The duplicate check treats them as two different numbers. In addition, 23% of the records have no deliverable email address, so the plan to personalize promotions by email must be reconsidered.
The lesson is that standardization must come before deduplication. A cleaning process in the right order has four steps, as in Figure 2.
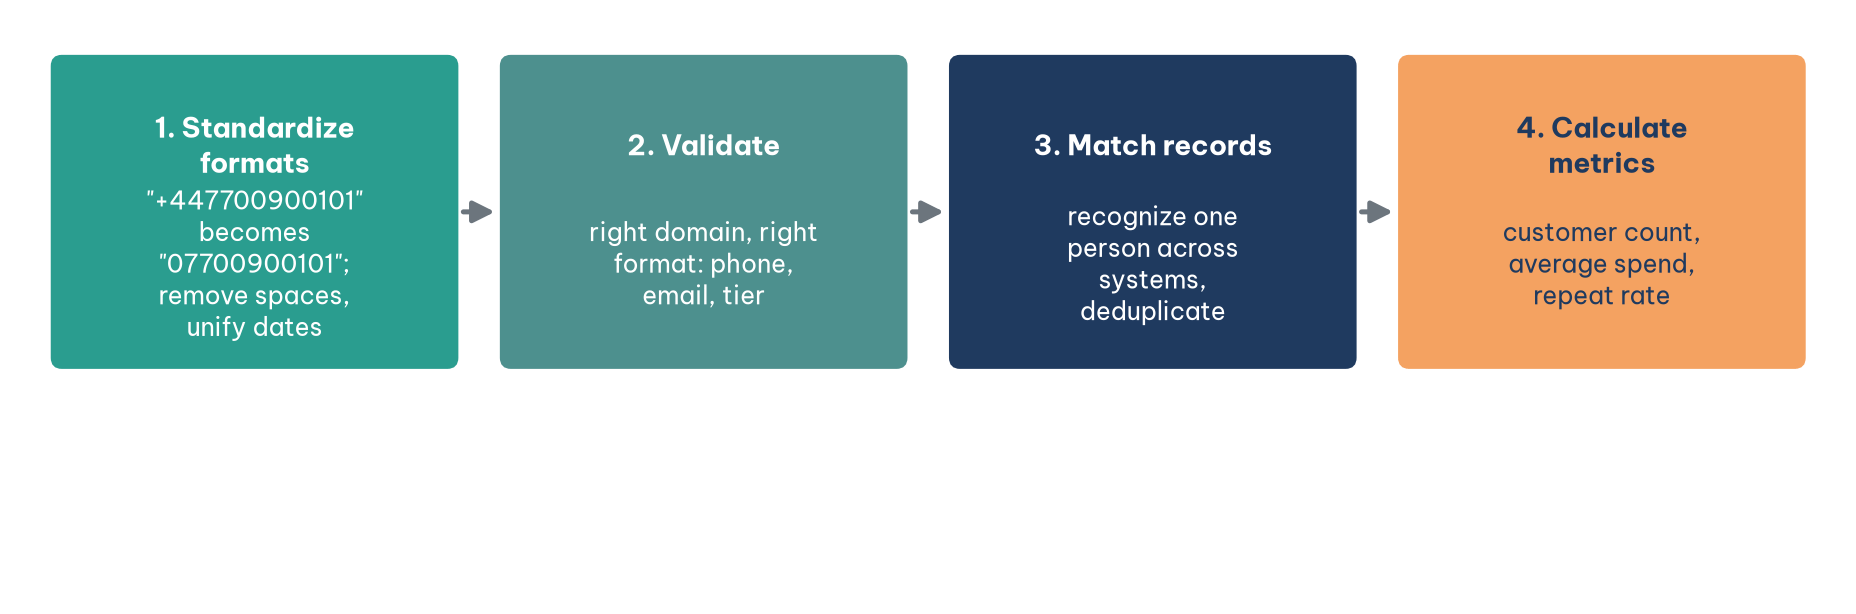
The order in Figure 2 is not arbitrary; each step uses the result of the one before. Validating unstandardized data would flag "+447700900101" as malformed even though it is a correct number. Matching records before standardizing would miss pairs that differ only in how they are written, exactly like the duplicate check at Nha Vui Home. And calculating metrics before matching would count 30 customers instead of 21. In a data warehouse, these four steps belong to the transform stage of extract, transform and load (ETL).
Record matching is the step that needs the most judgment. Two records with the same phone number may be one person, or two people sharing a number; two records with different numbers may still be one person who changed numbers. Matching rules should be written down with clear thresholds, and borderline cases should go to a person for review rather than being decided by the machine. This is also where bias in data begins, because decisions about who counts as "the same customer" shape every metric built on top.
The trap in this section is believing that "plenty of data is enough". Retailers often feel confident because they have millions of transaction rows. But systematic errors, such as each system writing phone numbers its own way, do not shrink as data grows; they multiply with it. An AI model trained on duplicated data will misjudge both customers and purchasing behavior. The way to avoid the trap is to run the checks on a sample of a few hundred records before discussing models; the result is usually enough to show how much needs to be invested in cleaning.
5. Data governance
Cleaning once does not keep data clean. The most common trap is measuring quality once and stopping: the dashboard in Figure 1 is a snapshot at one moment, while the app sends new sign-ups every day and an app update can suddenly raise the number of invalid emails. The mechanism of the trap is treating data quality as a project with an end date rather than an operating metric to be monitored. The right approach is to save the checks as views, run them on a schedule, track the trend of each check and build them into the loading process as a mandatory test.
Monitoring requires someone to be responsible. Data governance is the system that decides who may do what with which data, under which rules. A mid-sized business does not need a large apparatus, but it does need four minimum components, each blocking one kind of failure, as in Table 3.
The third component in Table 3 carries legal weight. Data protection laws such as the EU's General Data Protection Regulation give individuals rights to be informed, to access and correct their data, to have it erased and to withdraw consent (European Parliament & Council of the European Union, 2016), and many national laws grant similar rights. The consequence for data architecture is that the business must be able to find and erase every record of a person, which is impossible if one customer is scattered across three systems that nobody has matched. The record-matching step in Section 4 therefore serves not only analysis but also compliance.
The fourth component comes from a proposal by Gebru et al. (2021): every dataset used to train a model should come with a datasheet, like the data sheet that accompanies an electronic component. A datasheet forces the creators of data to write down limits that later users cannot guess, for example that returns data exists only from 2023 and so contains no holiday season from earlier years.
AI helps measure quality in two ways. From a data dictionary, an AI assistant can propose a list of checks for each column and write the queries that count violations. But every check AI proposes must be tested on real data and compared with business rules, because AI readily proposes a unique constraint on phone numbers, exactly the constraint that would wrongly block couples who share a number. In addition, never paste real customer data into public AI tools; paste only the column structure and a few sample rows replaced with fictional data.
Conclusion
Data quality is not a vague adjective but a set of measurements, set according to purpose. For Sen Vang Mart's 500 sign-ups, six quality dimensions produce nine checks, and only 56.4% of rows have no error at all. Adding up errors gives the wrong figure because duplicates lie in the relationship between rows, so clean rows must be counted directly and uniqueness measured with checks of its own.
Cleaning must follow the right order: standardize formats, validate, match records, and only then calculate metrics; reversing the order means counting 30 customers instead of 21. And because new data arrives every day, quality must be monitored as an operating metric, with owners, a catalog, access controls and datasheets, so that it does not decay again.
References
European Parliament & Council of the European Union. (2016). Regulation (EU) 2016/679 on the protection of natural persons with regard to the processing of personal data and on the free movement of such data (General Data Protection Regulation). https://eur-lex.europa.eu/eli/reg/2016/679/oj
Gebru, T., Morgenstern, J., Vecchione, B., Vaughan, J. W., Wallach, H., Daumé III, H., & Crawford, K. (2021). Datasheets for datasets. Communications of the ACM, 64(12), 86–92. https://doi.org/10.1145/3458723
Jukić, N. (2025). Database systems: Introduction to databases and data warehouses (3rd ed.). Prospect Press. https://www.prospectpressvt.com/textbooks/jukic-database-systems-introduction-to-databases-and-data-warehouses-3-0
Wang, R. Y., & Strong, D. M. (1996). Beyond accuracy: What data quality means to data consumers. Journal of Management Information Systems, 12(4), 5–33. https://doi.org/10.1080/07421222.1996.11518099
Discussion about this post