How to Build a One-Screen KPI Dashboard for a Small Business
Choose KPIs tied to decisions, fit them on one screen, give every number a benchmark and build it with free tools


Key takeaways
A KPI earns its place on a dashboard only if someone would act differently when it changes. Most small businesses need four to six KPIs, each paired with a decision.
Dashboards serve different levels of decision. A small business usually needs just two: a weekly dashboard for the owner and manager and a daily operational list for the shift lead.
A good layout fits on one screen and reads top to bottom as three questions: how did this week go, where is the trend heading and what needs doing.
A complete KPI card has five parts: value, comparison, small trend, exception color and metadata. Without a comparison, a number cannot say whether it is good or bad.
Free tools such as Google Sheets, Data Studio and Power BI Desktop make building easy. The hard part is cutting: after four weeks, remove every chart that has not led to a decision.
Picture the owner of a small coffee shop opening the new dashboard a tech-savvy nephew has built as a gift. The screen holds fourteen charts, three maps, two gauges and a spinning ring that counts social media likes. The colors are bright and the data refresh every hour. A week later the owner has stopped opening it. Nothing on it is wrong. The problem is that, after looking at it, the owner still cannot tell what to do differently today than yesterday.
This is the usual fate of dashboards in small businesses everywhere, from a bakery in Lisbon to a repair shop in Ohio. Building a dashboard is no longer hard: the tools are free and easy to use. What remains hard is building one that gets used, where every number on the screen leads to a decision by the right person.
A dashboard, like the instrument panel of a car, is a collection of visualizations and tables for monitoring business performance over a period or at a point in time (Camm et al., 2024). This article has five sections. Section 1 shows how to choose KPIs. Section 2 separates the levels of dashboards. Section 3 sets out layout principles and a template for a small shop. Section 4 takes apart a single KPI card. Section 5 proposes a five-step process for building a dashboard with free tools and lists the most common mistakes.
1. Choosing KPIs tied to decisions
This section gives a test for deciding which numbers belong on a dashboard and suggests starter sets for three common business models.
A dashboard should focus on the key performance indicators (KPIs) that are essential for decision-making rather than cramming in every measure available, which only causes information overload (Evans, 2021). The question for choosing a KPI is not "is this number important?" but "if this number changed, who would do what differently?" A number that cannot answer that question is decoration.
The right KPIs depend on the business model. Table 1 suggests a starter set for three types of small business.
The three rows of Table 1 share a pattern: each model needs only four to six KPIs, and each KPI comes with a decision. A common trap is to choose vanity metrics such as likes, followers or page views. They rise easily and look good, but they rarely lead to any decision. For a business that lives on repeat customers, the returning customer rate usually matters more than any reach metric, because repeat visits are what keep the doors open. For an online store, contribution margin matters more than revenue, because revenue can grow while profit shrinks, for example when discounts and paid ads buy sales at a loss.
2. Levels of dashboards
This section shows that the word "dashboard" covers tools for very different levels of decision, and draws the practical consequence for a small business.
Two examples in Camm et al. (2024) show the distance between those levels. A zoo wanted to manage by data, but its managers spent the day walking among visitors, so the dashboard was put on tablets: revenue by point of sale, where visitors came from, spending by weather and the loyalty program. In the first year the zoo recorded more than $500,000 in additional revenue, largely by matching staffing and stock to the weather forecast. At the other end, the IT help desk of an oil company needed a dashboard by shift: calls by problem type for every hour and a list of cases unresolved for more than 15 minutes, so that a case left over from the previous shift would surface immediately. Table 2 compares the three levels.
Table 2 explains why the dashboard in the opening story failed: it mixed all three levels on one screen. Hourly likes sat next to annual revenue, and the owner saw too many things that belonged to someone else. A small business usually needs only two dashboards: a weekly one for the owner and manager and a daily operational list for the shift lead.
3. Layout principles and a template for a small shop
This section summarizes the layout principles that the business analytics literature agrees on and applies them to a weekly dashboard for a hypothetical coffee shop.
The principles are few. One screen, no scrolling: if there is not enough room, build several dashboards instead of cramming; Evans (2021) caps a dashboard at six to eight graphics and places the most important indicator in the top-left corner, where the eye lands first. Every KPI tied to a decision of the right viewer. Restrained color: use one color to draw attention to exceptions, rather than turning the screen into flashing lights (Few, 2012). And contextualization: a number on its own means nothing, so every KPI needs a benchmark such as a target, the previous period or an industry norm (Sharda et al., 2024). Figure 1 applies these principles to the weekly dashboard of a coffee shop.
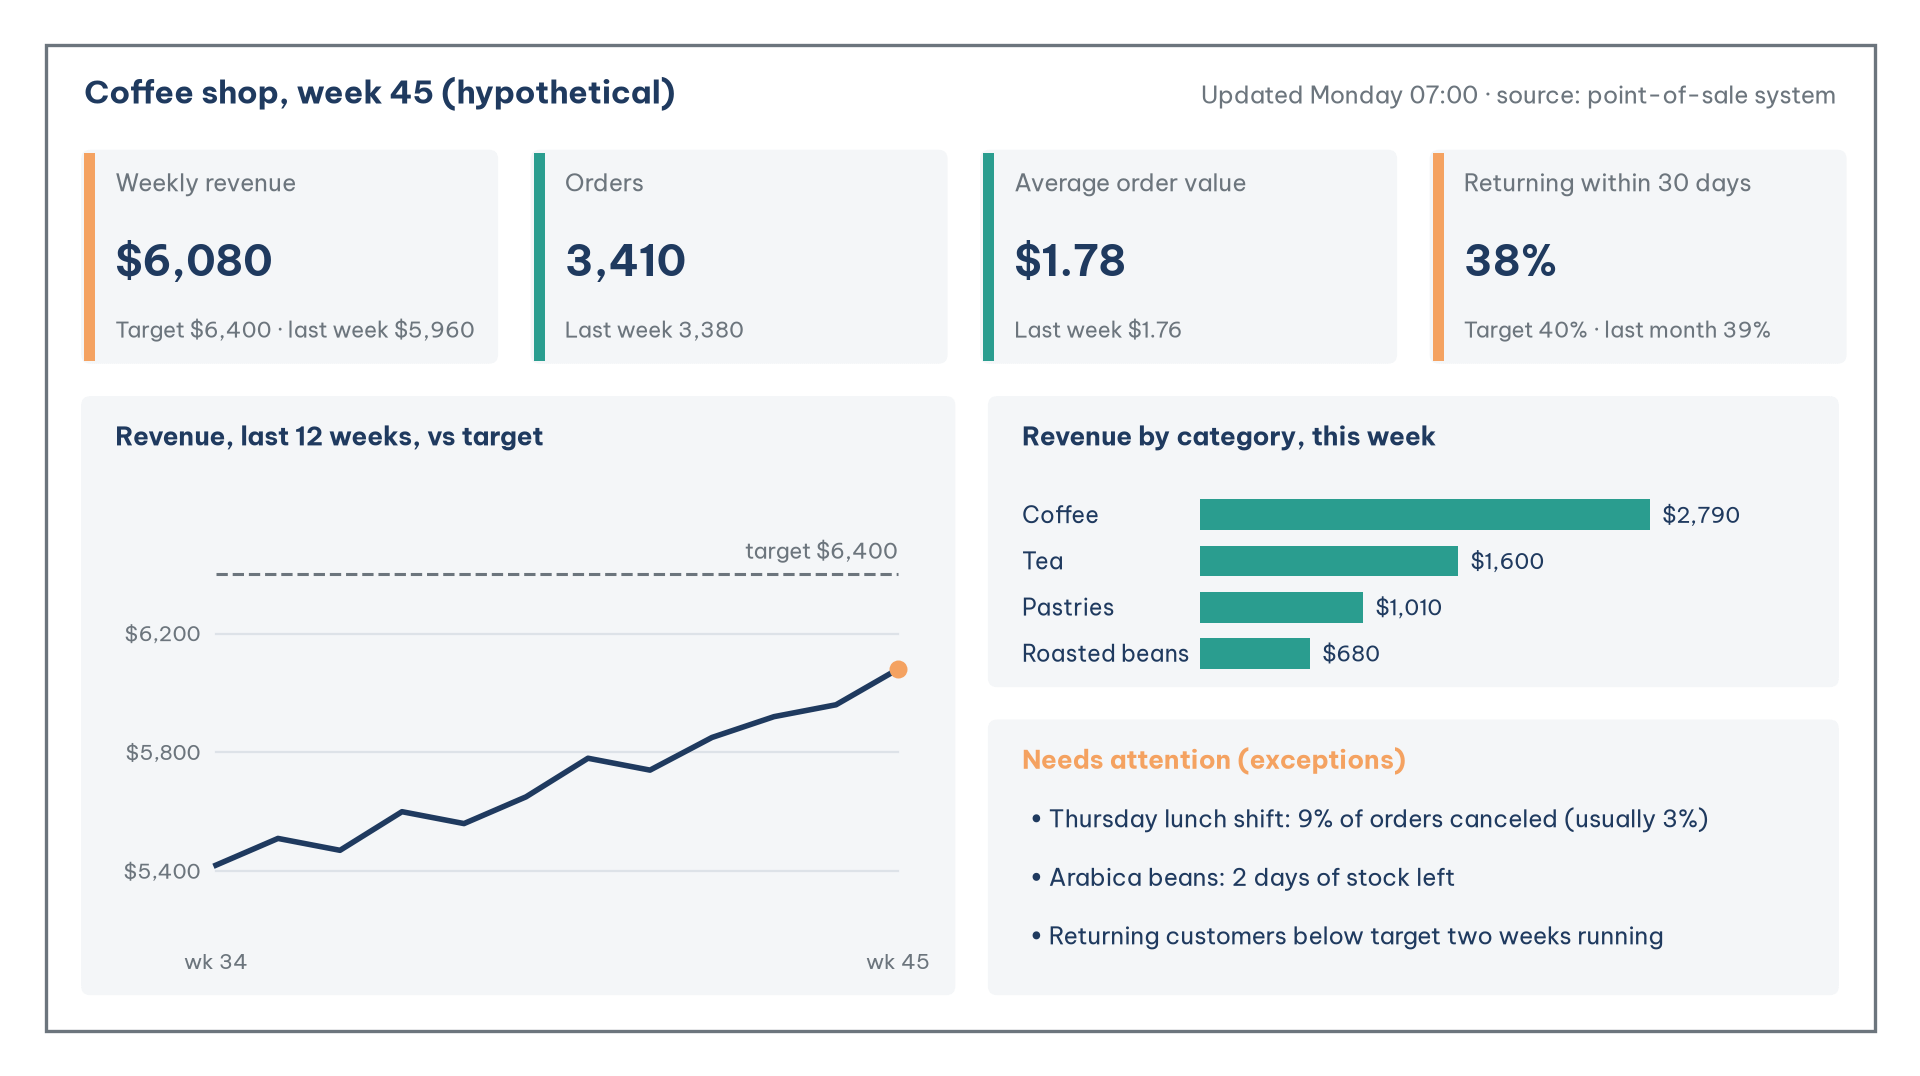
The layout in Figure 1 reads from top to bottom as three questions. The top row answers "how did this week go?": four KPI cards, each with a benchmark, and the two that fall short of target marked with an orange bar. Revenue of $6,080 is 95% of the $6,400 target, and 3,410 orders at an average of $1.78 account for it. The middle-left panel answers "where is the trend heading?": twelve weeks of revenue against the target line show whether this week is noise or part of a direction. Here revenue has climbed from $5,420 to $6,080 over twelve weeks, so the shortfall is a gap that is closing, not a sudden drop. The bottom-right panel answers "what needs doing?": a short list of exceptions, each specific enough to assign to someone. The exceptions panel is where the dashboard connects to diagnostic analysis: a lunch shift on Thursday with 9% of orders canceled, against the usual 3%, is the starting point of a search for causes rather than a conclusion.
Interaction also needs care. Distinguish dashboard-level filters, which act on every chart, from report-level filters, which act on one chart only, and name each filter so that its scope is clear and users do not believe they have filtered the whole screen when they have not (Richardson & Watson, 2024). A chart can also act as a filter: clicking the "Pastries" bar filters the other charts to that category.
4. Anatomy of a KPI card
This section looks at the smallest unit of a dashboard, the KPI card, and the five parts that make it useful.
The KPI card is also the part most often done carelessly: a single big number and nothing else. Figure 2 takes apart a complete card.
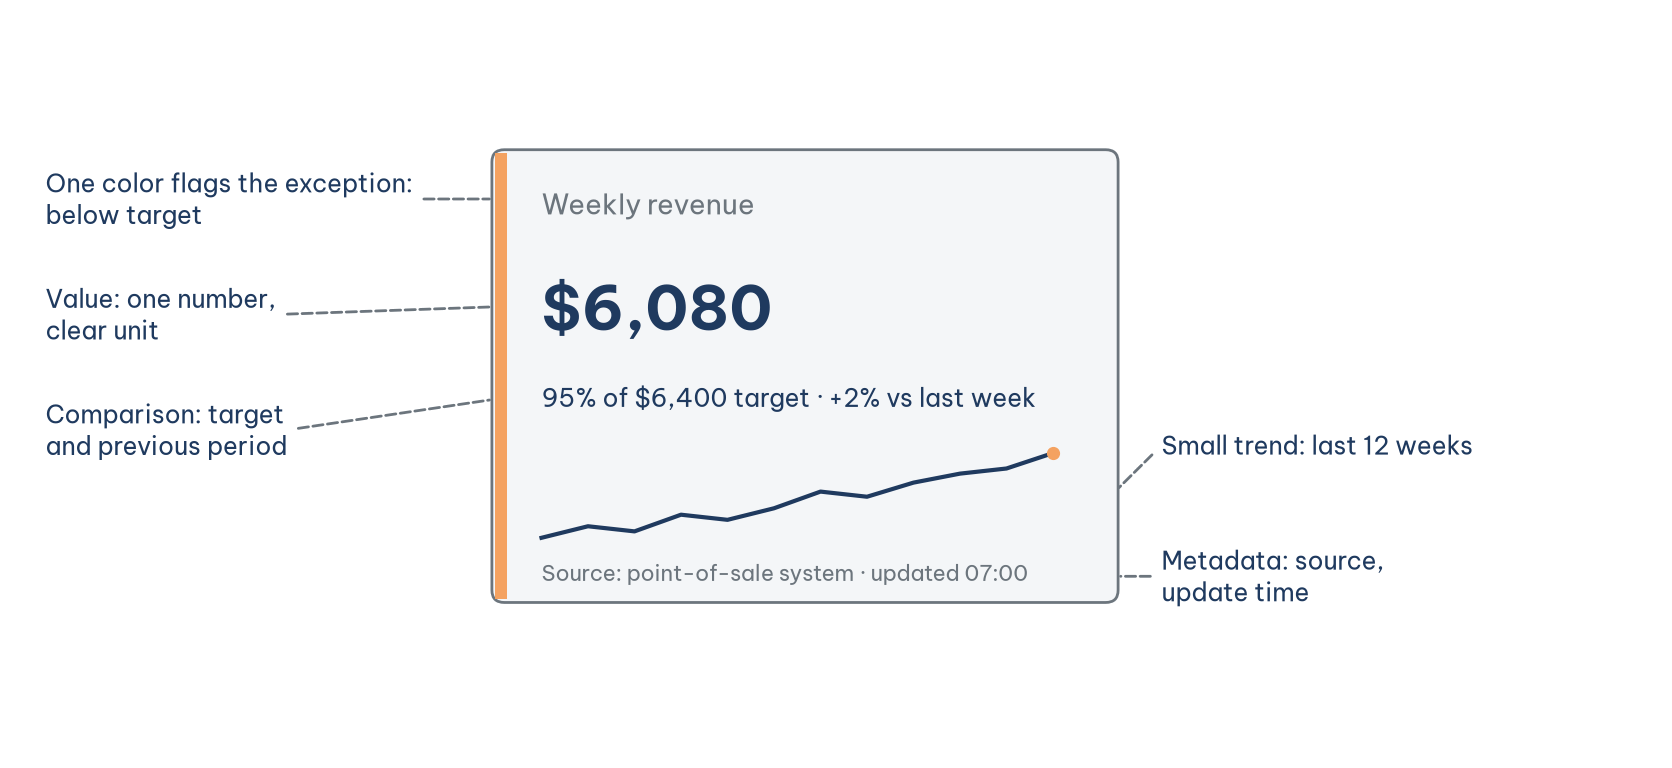
Each part in Figure 2 answers a question the viewer will ask. The value answers "how much?". The comparison answers "is that good or bad?": $6,080 is 95% of the $6,400 target and 2% above last week's $5,960, so the week is behind plan but not worse than the week before. The small trend answers "where is it heading?". The exception color answers "does this need my attention?". The metadata answer "can I trust this number?": the source, the time of the last refresh and, where relevant, the share of records rejected during loading. Sharda et al. (2024) call this contextualization; a dashboard without benchmarks is just a colored table of numbers, not a decision tool.
A dashboard is not a type of analysis but a form of presentation, and it can carry the results of several types at once. Each type needs its own companion on the screen. Descriptive figures need the scope of the data behind them. Diagnostic alerts need the strength of the evidence. Forecasts need a range of uncertainty rather than a single line. Recommendations need their assumptions and trade-offs stated.
5. A building process and the most common mistakes
This section proposes a five-step process for building a dashboard with free tools and names the three mistakes that most often kill small business dashboards.
A small business can build a dashboard like Figure 1 without paying for software. Three options are common. Google Sheets suits a simple dashboard updated by hand. Data Studio, Google's free reporting tool (called Looker Studio until April 2026, with a paid Pro tier for teams), suits a dashboard that connects directly to Google Sheets, Google Analytics and many other sources. Power BI Desktop, a free download from Microsoft, suits people who already work in Excel, although sharing reports with colleagues generally requires a paid license. Table 3 sets out the five steps.
Step 3 is the one most often skipped, and it is the source of most later arguments: does "revenue" on the dashboard include canceled orders, and does "returning customer" mean within 30 days or 90? A one-page KPI dictionary settles these questions at the start. The quality of the source data should also be tracked like a KPI in its own right, for instance the share of transactions with a missing product code or the delay between a sale and its appearance in the data.
The three most common mistakes can be summed up briefly. The first is cramming: adding every available number because the tool allows it, as the dashboard in the opening story did. The second is missing benchmarks: numbers stand alone, and viewers cannot tell good from bad. The third is never cutting: charts are only ever added, never removed, until nobody opens the dashboard anymore. The rule in step 5 is the cure: after four weeks, any chart that has not led to a decision goes.
AI can now produce a draft dashboard from a data table in minutes, and many dashboard tools, Power BI and Data Studio among them, include built-in AI assistants. AI does steps 4 and 5 well: sketching layouts, writing formulas, suggesting chart types. What it cannot do is step 1. It does not know what the coffee shop owner has to decide every Monday morning. Start from a list of decisions written by people, and only then ask AI to build.
Conclusion
Small business dashboards do not fail for lack of data or tools. They fail because they are not tied to decisions. Start from the list of decisions each person makes, choose four to six KPIs and separate the levels: a weekly dashboard for the owner and manager, a daily list for the shift lead. Lay it out on one screen that reads from top to bottom as three questions: how did this week go, where is the trend heading and what needs doing.
Every KPI card needs five parts: value, comparison, trend, exception color and metadata. Without a comparison, a number cannot say whether it is good or bad. With free tools such as Google Sheets, Data Studio or Power BI Desktop, the hardest part is not building but cutting: after four weeks, every chart that has not led to a decision should be removed.
References
Camm, J. D., Cochran, J. J., Fry, M. J., & Ohlmann, J. W. (2024). Business analytics (5th ed.). Cengage Learning. https://www.cengage.com/c/business-analytics-5e-camm-cochran-fry-ohlmann/9780357902202/
Evans, J. R. (2021). Business analytics (3rd global ed.). Pearson. https://www.pearson.com/store/p/business-analytics-global-edition/P200000004157/9781292339061
Few, S. (2012). Show me the numbers: Designing tables and graphs to enlighten (2nd ed.). Analytics Press. https://www.analyticspress.com/
Richardson, V. J., & Watson, M. W. (2024). Introduction to business analytics. McGraw Hill. https://www.mheducation.com/highered/product/introduction-business-analytics-richardson-watson/9781265450175.html
Sharda, R., Delen, D., & Turban, E. (2024). Business intelligence, analytics, data science, and AI: A managerial perspective (5th ed.). Pearson. https://www.pearson.com/en-us/subject-catalog/p/business-intelligence-analytics-data-science-and-ai/P200000009781
Discussion about this post