Five Sources of Bias in How Data Is Born
A perfectly clean table can still record the world wrongly if the way the data was produced was skewed from the start


Key takeaways
Data cleaning fixes errors inside a table; it cannot fix bias built into the way the data was produced.
Historical bias: internal data records past decisions, so a model trained on it learns how the organization used to decide.
Label bias: a column assigned by people or models carries their criteria; measure agreement between labelers before trusting it.
Reporting bias: only unusual events get recorded, which is why online reviews follow a J-shaped distribution.
Recall bias and the observer (Hawthorne) effect arise when data comes from people; prefer transaction records and system logs where possible, and add a line to the data dictionary saying how each dataset was created.
Amazon once built a tool to score job applications, trained on the résumés submitted over the previous ten years in an industry that was mostly male. The data had no typos, no missing rows and no duplicates. Even so, the tool taught itself to downgrade applications containing the word "women's", as in "women's chess club captain", and it was eventually scrapped (Dastin, 2018). No cleaning step could have caught the problem, because the data was not wrong: it recorded very accurately what had happened.
Data cleaning, such as fixing formats, removing duplicates and handling missing values, corrects errors inside a table. It does not correct distortion built into the way the data was produced. A perfectly clean table can still record the world in a systematically skewed way. So before cleaning, an analyst should ask three questions: who or what created this data, for what purpose, and what never gets recorded here.
This article reviews the five sources of bias most often met at the data collection stage. Section 1 places the five sources in a common picture. Sections 2 to 5 cover historical bias, label bias, reporting bias and two biases that arise when data comes from people, recall bias and the observer effect. Section 6 brings the five together into a self-check table and suggests a habit for the data dictionary.
1. The five sources in a common picture
Bias can enter at many stages of an analysis. Biases that arise in sampling, such as selection bias, non-response and survivorship bias, belong to statistics. Biases in how a question is framed belong to the stage of defining the problem. This article focuses on data collection, where five sources of bias arise from the very process that creates the data, as shown in Figure 1.
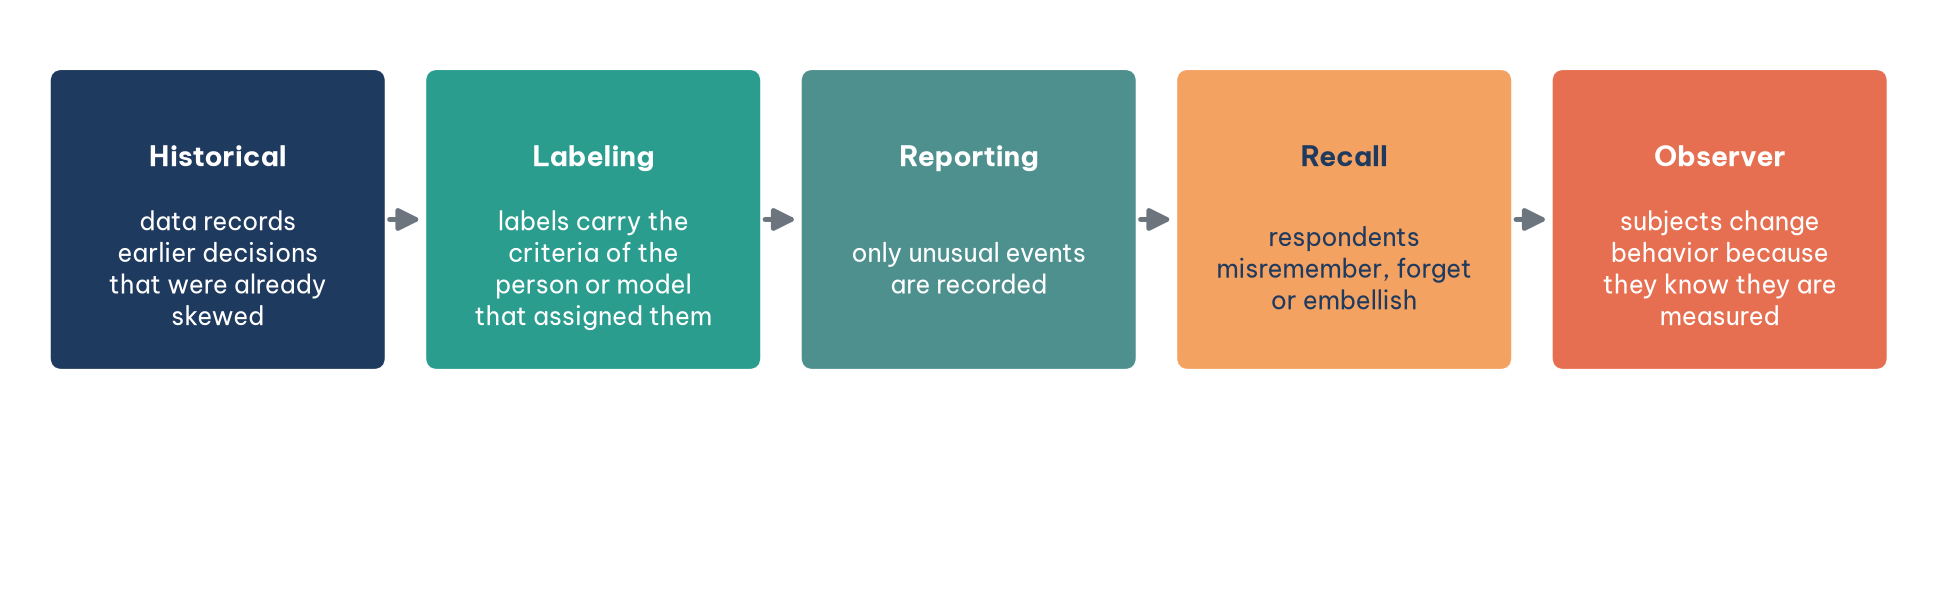
What the five sources in Figure 1 have in common is that no cleaning step detects them; they surface only when the analyst asks how the data came into being. When such data is used to train AI models, the bias is not just carried over but often amplified.
2. Historical bias
Most of a business's internal data is a record of past decisions: who was hired, which loans were approved, which customers received attention, which products were given the best shelf space. Historical bias occurs when data accurately records a past that was already skewed and is then used to shape the future. It is especially hard to spot because the data is not wrong: it describes exactly what happened. Amazon's recruiting tool at the start of this article is the classic example.
Dropping a sensitive column such as gender is usually not enough, because other columns, such as place of residence, school attended or career gaps, can stand in for it. The self-check question at the collection stage is: does this data record the world, or does it record our own decisions about the world? If the latter, any model that learns from it will also learn how we decided. A familiar retail example: sales data shows only what customers bought among the items that were displayed. Items that were never displayed never get a chance to appear in the data, and a recommendation model trained on it will keep not recommending them.
3. Label bias
Many tables have a column that is not recorded automatically by a system but assigned by a person or a model: complaint category, fraud flag, sentiment of a review, reason for leaving. This section describes the bias that arises in such columns and how to keep labels trustworthy.
3.1. Labels carry the labeler's criteria
Label bias occurs when labels carry the labeler's own criteria, are inconsistent from one labeler to another, or are systematically skewed for one group. One study found that datasets used to train toxic-language detectors labeled sentences written in African American English as "toxic" far more often, and the models learned exactly that skew (Sap et al., 2019). In business, a "serious complaint" label decided by each call-center agent, or a "fraud" label that exists only for transactions that were investigated, are columns to read with the same eye. The fraud label is a subtle case: a transaction that is never investigated can never be labeled fraudulent, so the data equates "not detected" with "not fraudulent".
3.2. Three habits for trustworthy labels
Three habits help keep labels trustworthy. First, write labeling guidelines down, with examples for borderline cases. Second, have two people label the same sample independently and measure their agreement beyond chance, usually with the kappa coefficient (Cohen, 1960); a low kappa means the guidelines are not clear enough or the concept is not defined consistently. Third, record in the data dictionary who, or which model and version, assigned the labels. Labels assigned by AI are increasingly common, for example using AI to classify the sentiment of thousands of comments, and they need exactly the same check: comparison against a sample labeled by hand. A confusion matrix is the natural tool for measuring how well machine labels match human labels.
4. Reporting bias
Reporting bias occurs when only what is unusual, striking or significant gets recorded, while the ordinary does not. An incident management system has a row only when a machine breaks; a customer service log has a row only when a customer calls; the news covers a flight only when there is an accident.
Online product reviews are the clearest example. Very satisfied and very annoyed customers write reviews far more often than those who feel the product was fine, so the distribution of star ratings is usually J-shaped: concentrated at five stars, a little at one star and sparse in between. The average rating is therefore not the satisfaction of customers as a whole (Hu et al., 2009). Figure 2 illustrates the difference between the two distributions.
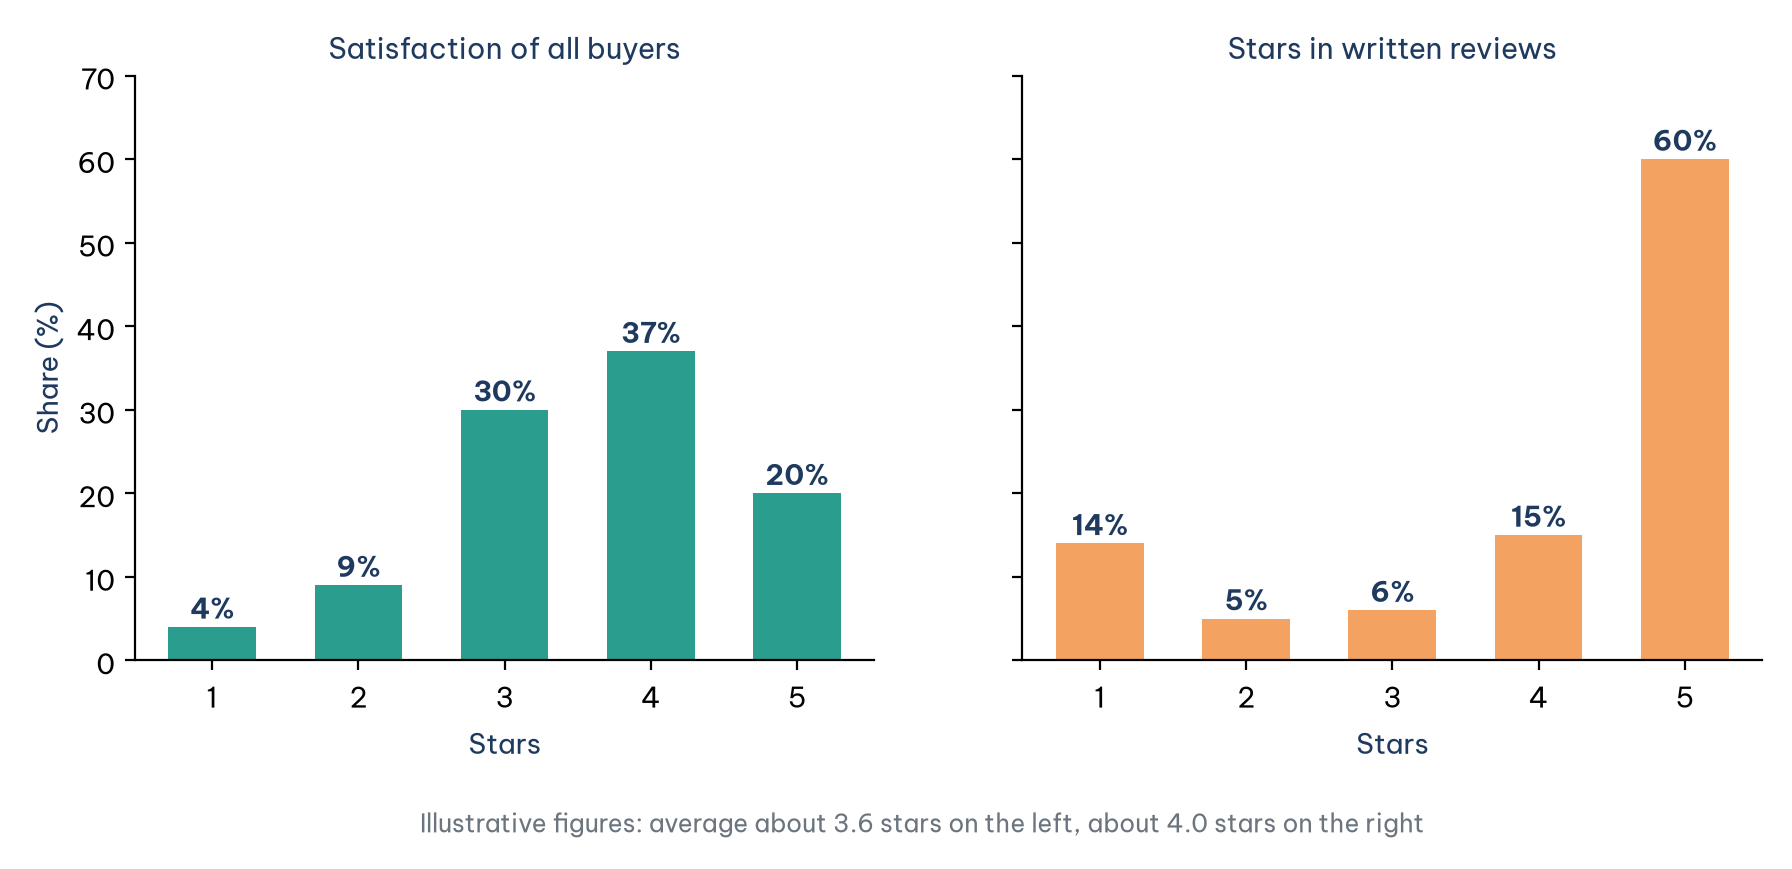
Figure 2 shows two very different readings of the same product: online reviews give an average of about 4.0 stars and suggest that nearly every customer is delighted, while most customers actually find it merely acceptable. This bias is especially strong in text data and in generative AI, which learns from what people choose to write. The remedy is to set "reported" data beside behavioral data, such as repurchase rates or return rates, and always to ask: what happens every day that nobody records? Segmenting customers by recency, frequency and monetary value is one example of using behavior instead of testimony.
5. When data comes from people
The last two biases arise when data comes from people: one from memory, one from knowing that you are being measured. This section takes them in turn.
5.1. Recall bias
Recall bias occurs when respondents misremember, forget or embellish the past. A survey asking "how many times did you buy takeaway coffee in the past six months?" receives a number the respondent estimates, usually pulled toward recent or memorable occasions. Memory is also shaped by the question itself: in a classic experiment, people who watched the same film of a car accident estimated higher speeds when the question used the verb "smashed" rather than "hit" (Loftus & Palmer, 1974). Where possible, use transaction data instead of recalled data; where you must ask, use a short and specific time frame, such as "last week" rather than "the past six months".
5.2. The observer effect
The observer effect, often called the Hawthorne effect, occurs when subjects change their behavior because they know they are being measured. Staff who know a task is being timed work faster than their normal pace; a store that knows an inspection is coming arranges its displays better than usual. The name comes from experiments at the Hawthorne plant in the 1920s and 1930s, although a reanalysis of the original data found the effect there much weaker than the story usually told (Levitt & List, 2011). The lesson still holds for anyone collecting data: a productivity standard measured during a week when someone was watching should be checked against data the system records on its own, or at least with a sensitivity test, for example recalculating results with a standard 10% lower and 10% higher.
6. A self-check table and the data dictionary
The five sources of bias can be gathered into a self-check table for the data collection stage, as in Table 1.
Table 1 leads to a simple habit: an organization's data dictionary should include one more line describing how the data was created, that is, by which system, entered by whom, at what moment and which cases never appear. That line takes a few minutes to write but saves later analysts from guessing.
Conclusion
The five sources of bias in this article, historical, label, reporting, recall and observer, share one feature: they are not errors in the table but errors in the way the table was produced. That is why no cleaning step detects them, and a table with correct types, no duplicates and no gaps can still lead to skewed conclusions.
The defense lies not in tools but in the habit of asking where data comes from: who or what created it, for what purpose and what never gets recorded. Setting reported data beside behavioral data, measuring label agreement, asking about short time frames, checking standards against system-recorded data and writing down how data was created in the data dictionary are small practices that help analysts see the real world behind the numbers.
References
Cohen, J. (1960). A coefficient of agreement for nominal scales. Educational and Psychological Measurement, 20(1), 37–46. https://doi.org/10.1177/001316446002000104
Dastin, J. (2018, October 10). Amazon scraps secret AI recruiting tool that showed bias against women. Reuters. https://www.reuters.com/article/us-amazon-com-jobs-automation-insight-idUSKCN1MK08G
Hu, N., Pavlou, P. A., & Zhang, J. (2009). Overcoming the J-shaped distribution of product reviews. Communications of the ACM, 52(10), 144–147. https://doi.org/10.1145/1562764.1562800
Levitt, S. D., & List, J. A. (2011). Was there really a Hawthorne effect at the Hawthorne plant? An analysis of the original illumination experiments. American Economic Journal: Applied Economics, 3(1), 224–238. https://doi.org/10.1257/app.3.1.224
Loftus, E. F., & Palmer, J. C. (1974). Reconstruction of automobile destruction: An example of the interaction between language and memory. Journal of Verbal Learning and Verbal Behavior, 13(5), 585–589. https://doi.org/10.1016/S0022-5371(74)80011-380011-3)
Sap, M., Card, D., Gabriel, S., Choi, Y., & Smith, N. A. (2019). The risk of racial bias in hate speech detection. In Proceedings of the 57th Annual Meeting of the Association for Computational Linguistics (pp. 1668–1678). Association for Computational Linguistics. https://doi.org/10.18653/v1/P19-1163
Discussion about this post