How to Build Customer Profiles from Raw Transaction Data
A five-step process that turns order logs into customer profiles through statistics and clustering, then into actions a business can measure


Key takeaways
Profiling describes the typical behavior of a group, not the average of everyone. An average merges very different people into one number; a profile shows who is behind it.
A useful profile follows five steps: set the business goal, collect and explore the data, choose a method, build and interpret the profiles, then act and refine.
Clustering finds the groups, but people still name them and decide how many there are. In a simulated store of 2,000 customers, four clusters emerge and one quarter of the customers bring in about 80% of revenue.
Hard clustering puts each customer in exactly one group; soft clustering gives probabilities and exposes the customers sitting between groups, often the ones whose behavior is changing.
Profiling people is processing personal data. Be transparent, avoid fully automated decisions with serious effects and never use a profile to exploit people who struggle to control their spending.
Almost every company now collects more data about its customers than it can read. An online store with a few thousand buyers easily accumulates a million rows of orders, page views and support tickets within a year. Yet a table of a million rows tells a marketing director nothing. A sentence such as "one customer in four brings in most of our revenue, buys on weekends through the app and usually adds an accessory" tells her a great deal. The distance between the table and that sentence is where most analytics projects succeed or fail.
One of the most common ways to cross that distance is profiling. Provost and Fawcett (2013) list profiling, which they also call behavior description, among the basic tasks of data science, alongside classification, regression, clustering and co-occurrence grouping. Profiling turns scattered numbers into portraits of behavior that a team can act on. It appears in nearly every industry, from marketing, banking and insurance to cybersecurity, healthcare and video games. Precisely because it draws portraits of people, it also raises serious questions about privacy and fairness.
This article walks through profiling from raw records to decisions. Section 1 defines profiling and separates it from averages. Section 2 sets out a five-step process. Section 3 introduces the main families of methods, from descriptive statistics and business rules to hard and soft clustering. Section 4 works through an example: turning an order log into customer features, then clustering 2,000 simulated customers and reading the clusters. Section 5 shows how to turn profiles into actions that can be measured. Section 6 reviews ten applications across industries, and Section 7 discusses the pitfalls to avoid.
1. What profiling is
This section defines profiling and explains why it answers questions that averages cannot.
At its core, profiling is the systematic description of the typical behavior and characteristics of an entity. The entity can be almost anything: a customer, a market segment, a product line, an employee, a delivery route or even a cyberattack.
Imagine you are an investigator. An ordinary report tells you only that "there is a suspect". Profiling helps you draw a portrait of that suspect: age range, habits, methods and likely motives. The portrait does not name the person, but it narrows the search and tells you where to look.
In business, profiling answers questions that go beyond surface metrics. Instead of asking "what is the average revenue per customer?", a profile answers: "What do the customers who bring in most of our revenue look like? When do they buy, through which channel and what do they buy together?" An average merges everyone into a single number. A profile shows that very different groups of people stand behind that number, and a decision that suits one group may be wrong for another.
The goal of profiling is a multidimensional description, a detailed "character sheet", that can support strategic decisions about whom to serve, how and when.
Two meanings of "profiling". In data engineering, data profiling also means assessing the quality of a dataset: how many values are missing in each column, which values look abnormal, whether data types are consistent. This article is about the first meaning, describing the behavior of an entity. The second meaning, however, is the step to take first, following the old rule of "garbage in, garbage out".
Profiling is not a magic button. It is a process with a method, and the next section lays it out.
2. A five-step process
This section describes the five steps that take a profiling project from a business question to an action, as summarized in Figure 1.
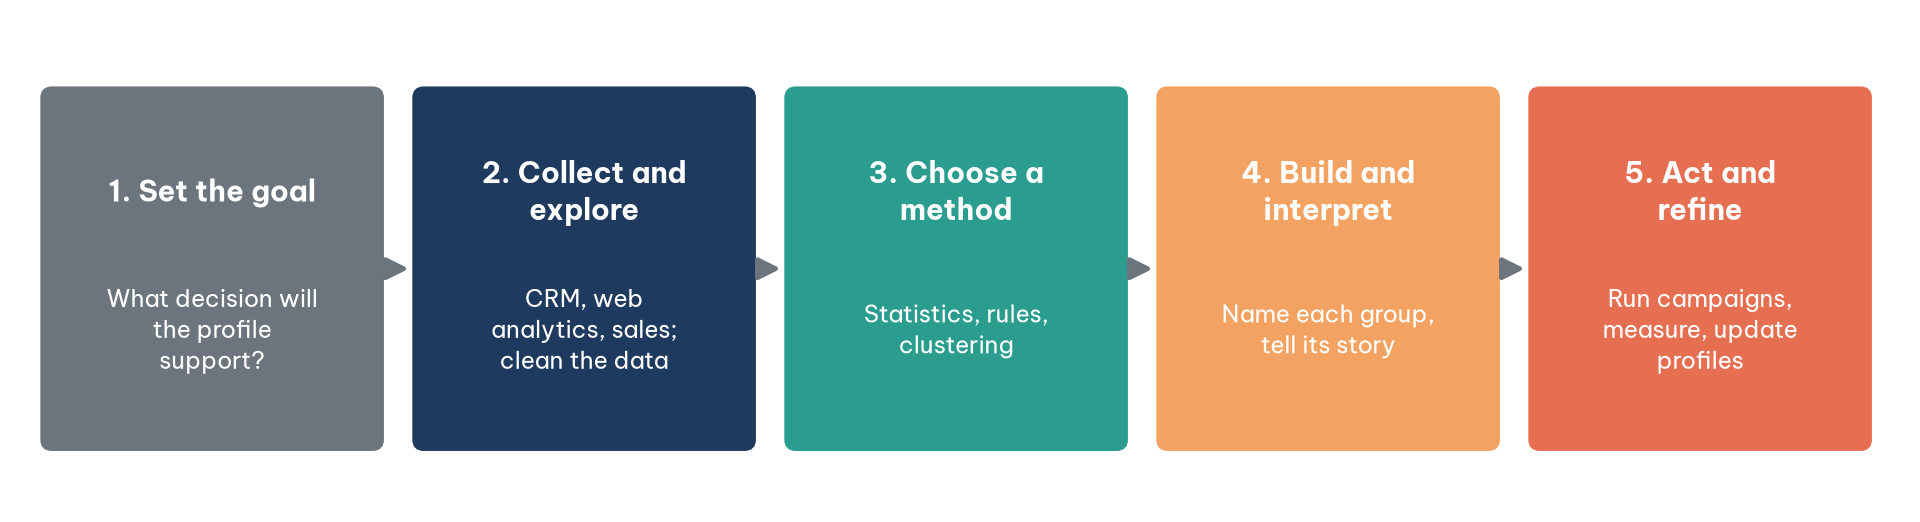
Step 1: set the business goal. Start with "why?". What decision is the profile meant to support: reducing customer churn, raising the average order value or allocating an advertising budget? The goal decides which data you need, which features matter and even how the groups should be named. A profile built to cut churn will emphasize recency and complaints; a profile built to plan inventory will emphasize product categories and seasons.
Step 2: collect and explore the data. Bring together data from several sources: the customer relationship management (CRM) system, web analytics and the sales system. This is the moment to visualize, clean and understand your raw material, including the data quality assessment described in the box above. Many projects discover here that the same customer appears under three different email addresses, or that refunds are recorded as negative orders and quietly reduce the totals.
Step 3: choose a method. Based on the goal and the data, choose the right "brush" for the portrait (Section 3). Simple descriptive statistics are always the first stroke; business rules and clustering come after.
Step 4: build and interpret the profiles. Run the analysis and, most importantly, translate the results into plain business language. A profile has value only when it tells a story that decision makers understand and believe. A cluster labeled "cluster 2" changes nothing; a group described as "recent first-time buyers who spent little and have not yet come back" suggests an obvious next move.
Step 5: act and refine. Put the profiles to work, for example in a new marketing campaign, then measure the results and update the profiles. Customer behavior changes, so profiles must change with it. A profile that was right last year can be quietly wrong today.
3. Methods for building profiles
This section introduces three families of methods, from simple to complex. Table 1 summarizes them before each is discussed in turn.
3.1. Statistical profiling
Descriptive statistics are the foundation of every other method. When data are roughly symmetric (bell-shaped), the mean and standard deviation describe the center and the spread well. When data are skewed, as customer spending almost always is (most people spend a little, a few spend a lot), the median and percentiles give a more faithful picture because they are much less sensitive to outliers. A single corporate client placing one very large order can double the mean spending of a whole store while the median barely moves. In the simulated store used in Section 4, the mean customer spent about $202 over the year while the median customer spent about $58: the mean is pulled up by a small group of heavy buyers.
3.2. Rule-based profiling
Rule-based profiling uses expert knowledge to define groups. The classic example in customer work is RFM, which has its roots in direct-mail catalog marketing and was popularized for database marketing by Hughes (1994). RFM rests on three questions:
Recency (R): how long ago did the customer last buy?
Frequency (F): how many times has the customer bought?
Monetary value (M): how much has the customer spent in total?
In a rule-based approach, each customer receives a score on each dimension, often from 1 to 5 by quintile, and the scores are combined into named segments with fixed rules. Rules are transparent and easy to explain to a sales team, which is their great strength. Their weakness is that the analyst must know the groups in advance. In this article RFM plays a different role: the three raw values R, F and M are simply useful inputs to a profile, alongside any other features the goal calls for, such as product categories, channels or service contacts.
3.3. Clustering to discover profiles
Clustering is the most powerful way to discover hidden groups automatically, and it works in two steps.
Step 1: clustering. Algorithms such as K-Means or DBSCAN put objects with similar features into the same cluster. This step answers the question: "What hidden groups are there in my data?"
Step 2: profiling. Once clusters exist, describe each one with statistics or rules. This step answers: "What does group A look like? How is it different from group B?" Clustering finds the groups; profiling tells their story. The algorithm returns only labels such as 0, 1, 2 and 3. Everything a manager actually uses (the names, the descriptions, the recommended actions) comes from the profiling step.
3.4. Hard and soft clustering
Methods such as K-Means perform hard clustering: each customer belongs to one and only one cluster. Human behavior is rarely that tidy. Soft clustering, of which the Gaussian mixture model (GMM) is the best-known example, allows an object to belong to several clusters with different probabilities. A customer might be described as "70% bargain hunter and 30% loyal shopper". Figure 2 shows the difference on simulated data.
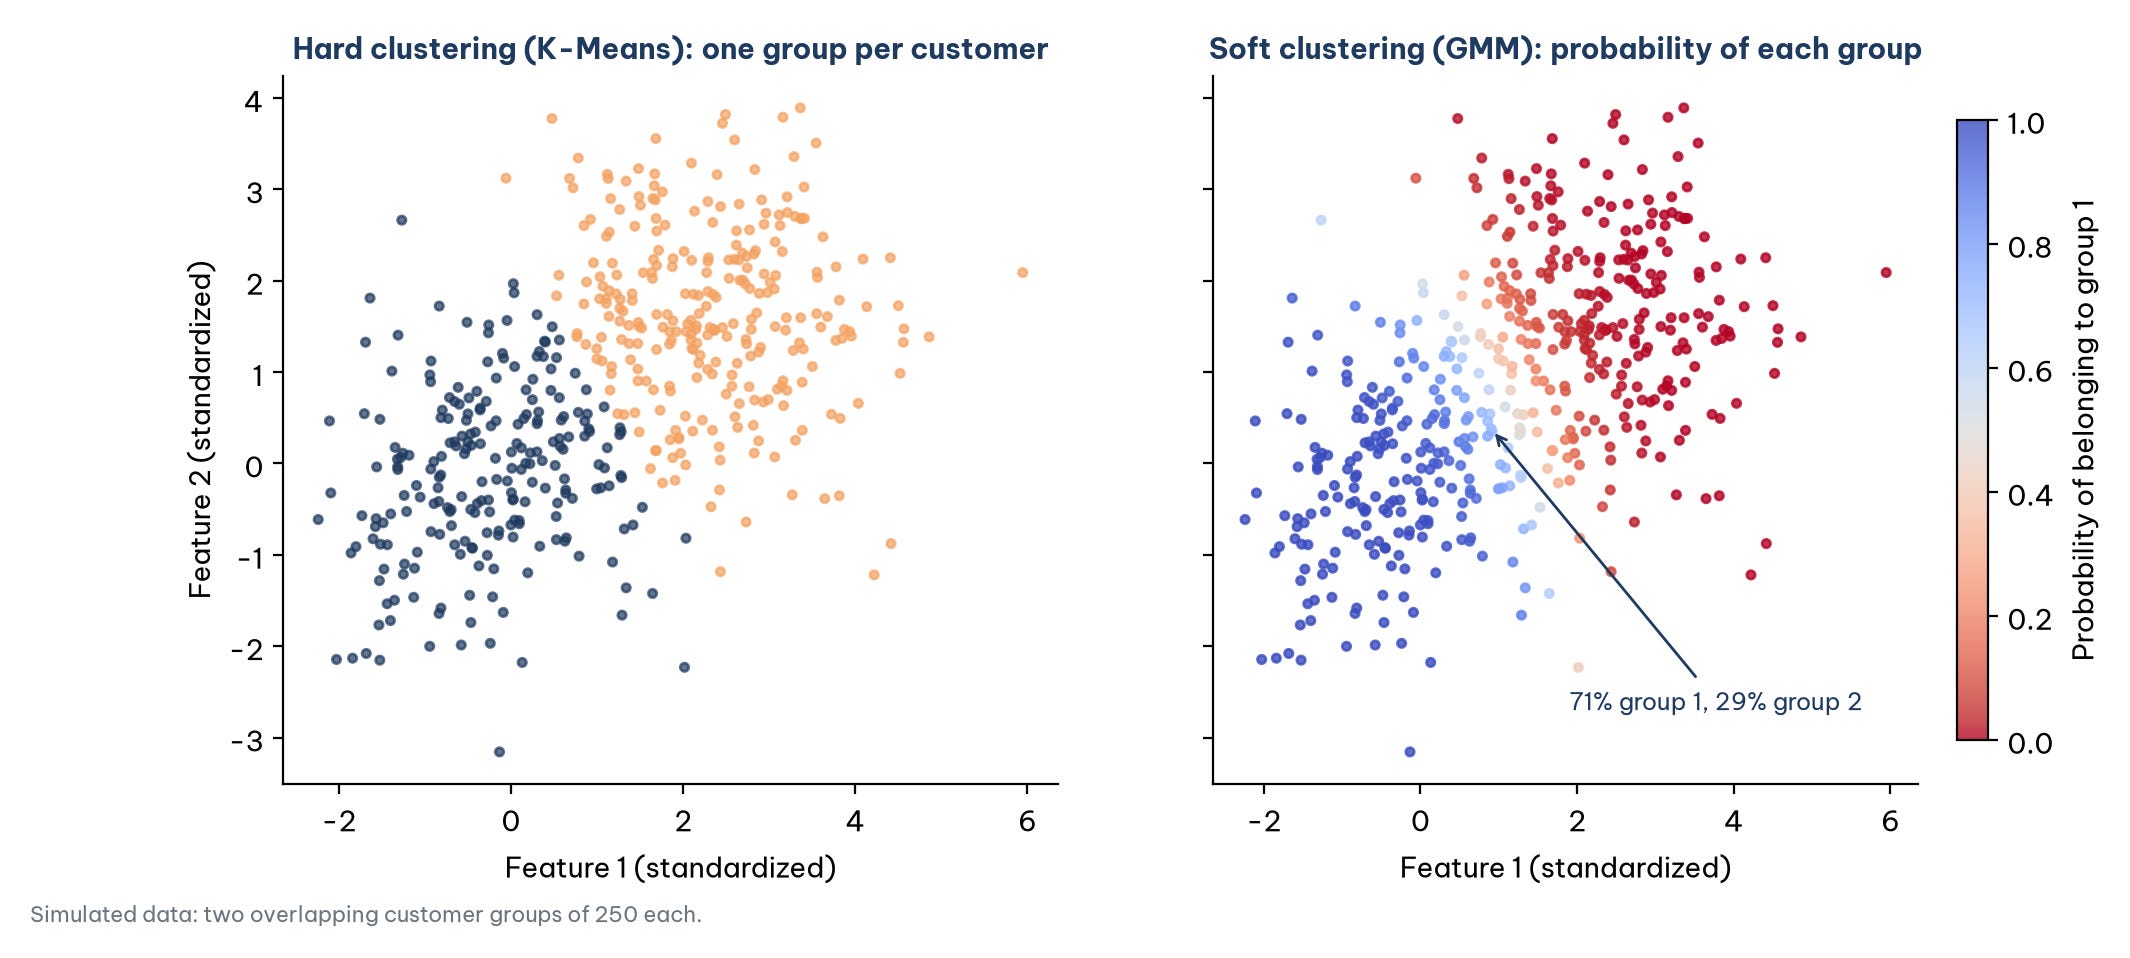
On the left of Figure 2, K-Means draws a hard boundary: customers who sit right next to the boundary are assigned to one group or the other just as firmly as customers far away from it. On the right, the GMM reveals a middle zone where customers carry features of both groups. In this simulation, 66 of the 500 customers have a probability between 20% and 80% of belonging to group 1, so neither label really fits them. This view captures the flexibility and variety of real behavior and makes profiles more realistic. In marketing, it allows a blended message for in-between customers instead of forcing them into one box. It also flags customers in transition, a point Section 4 returns to with a larger dataset.
That is enough theory; the next section tries the ideas on data.
4. Worked example: from an order log to customer profiles
This section moves from raw records to named profiles in two stages: first turning an order log into one row of features per customer, then clustering 2,000 simulated customers and describing the clusters.
4.1. From raw orders to customer features
Raw transaction data almost never arrive in the shape a profile needs. They come as one row per order, while a profile needs one row per customer. The first technical step is therefore feature engineering: aggregating the order log into a customer table. Suppose an online store has the order history of five customers (illustrative figures in US dollars) and the analysis date is October 1, 2026.
import pandas as pd

orders = pd.DataFrame({
    "customer": ["Ana", "Ana", "Ana", "Ben", "Chloe", "Chloe",
                 "Dev", "Dev", "Dev", "Dev", "Hana"],
    "date": pd.to_datetime(["2026-09-28", "2026-08-15", "2026-06-02", "2026-03-10",
                            "2026-09-30", "2026-09-05", "2026-09-25", "2026-09-10",
                            "2026-08-20", "2026-07-30", "2026-05-01"]),
    "amount": [18, 12, 10, 48, 8, 6, 32, 36, 28, 34, 4],  # USD
})
as_of = pd.Timestamp("2026-10-01")

features = orders.groupby("customer").agg(
    R=("date", lambda d: (as_of - d.max()).days),  # days since last purchase
    F=("date", "count"),                           # number of purchases
    M=("amount", "sum"),                           # total spending (USD)
)
features["avg_order"] = (features["M"] / features["F"]).round(2)
print(features)
The output is shown in Table 2.
Even five rows already tell stories that the order log hid. Ben placed the largest single order of the five, yet he has not returned for 205 days, so he would be a natural target for a win-back message. Ana and Ben have similar totals ($40 and $48) but very different patterns: Ana buys small baskets often and recently, while Ben bought once and may already be gone. With five customers a person can read the table directly. With thousands, the same features become the input for clustering. In real projects the feature table is usually wider: share of orders placed through the app, number of product categories, discount usage, returns or support tickets. The choice of features goes back to the goal set in Step 1.
4.2. Clustering 2,000 customers
With five customers, reading the table is enough. With thousands, an algorithm can propose the groups. Figure 3 shows the result on simulated data for 2,000 customers of an online store. K-Means splits the customers into four clusters based on R, F and M. Because spending and frequency are strongly skewed, the three variables were log-transformed and then standardized before clustering, so that no single variable dominates the distances.
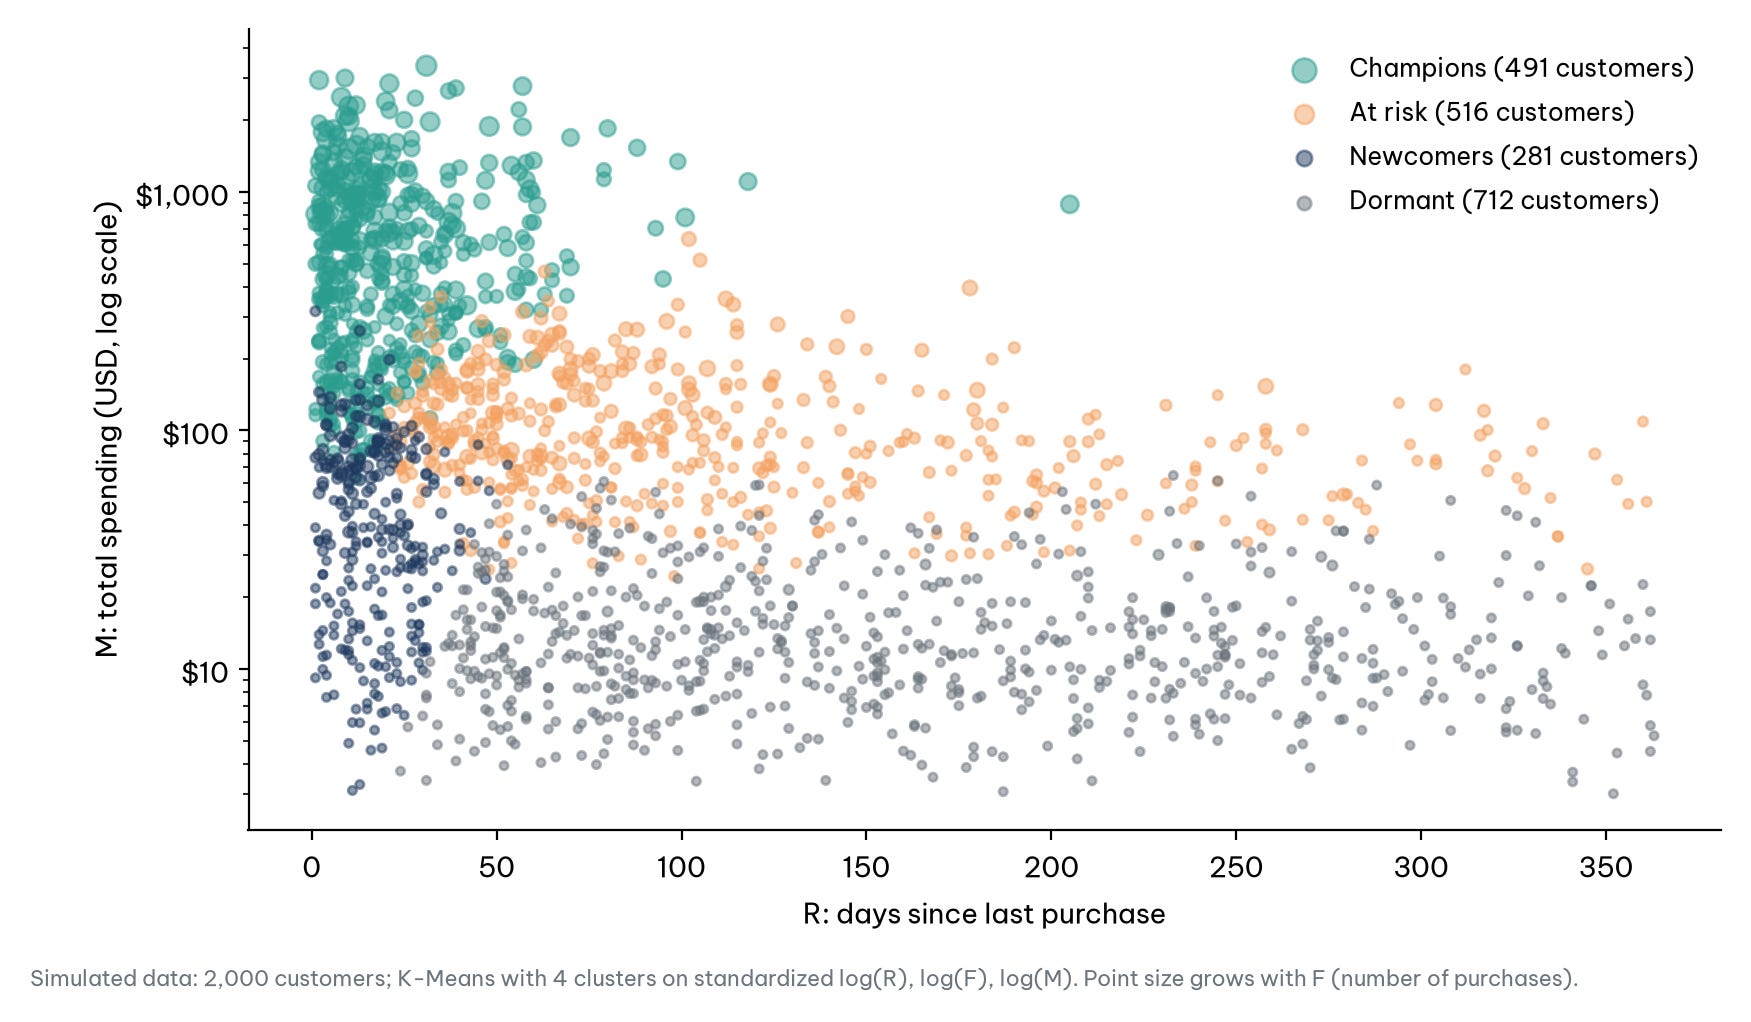
The algorithm returns only "cluster 0, 1, 2, 3". The profiling step is to describe each cluster and give it a name, as in Table 3.
Table 3 tells a clear story. About a quarter of the customers (the Champions, 24.6%) bring in almost 80% of revenue: this is the group to protect at almost any cost. The At-risk group has bought a few times but has not returned for about three months: this is where a reactivation campaign belongs. Newcomers have just made their first purchase, so the aim is to bring them to a second one. The Dormant group is the largest but contributes the least, and low-cost messages are probably all it justifies.
Three things deserve attention when reading Table 3. First, the names are chosen by people, based on the numbers and on business knowledge; another analyst might call the Newcomers "triers". Second, the number of clusters is the analyst's choice. A common check is the silhouette coefficient (Rousseeuw, 1987), which compares how close each customer is to its own cluster with how close it is to the nearest other cluster, on a scale from −1 to 1. On these data the silhouette is 0.49 for two clusters, 0.39 for three, 0.41 for four, 0.38 for five and six and 0.37 for seven. Two clusters fit the geometry best, but they separate only active from lapsed customers, which is too coarse to act on. Four clusters score best among the more detailed solutions, and that, together with the business goal, justifies the choice. Third, hard boundaries hide movement. When a Gaussian mixture model is fitted to the same data, starting from the four K-Means centers, 345 customers (17%) have no cluster with a probability above 80%. Most of them sit on the border between Champions and At risk (142 labeled Champions and 174 labeled At risk by K-Means). These are customers whose behavior is shifting, often the most valuable people to watch. The two methods also disagree on about half of the 281 Newcomers, which the mixture model places with the Dormant group: whether a one-time buyer from two weeks ago is "new" or "fading" depends on a boundary the analyst has to decide.
Profiling is therefore both science and disciplined storytelling. The numbers constrain the story, but people still have to tell it, and tell it honestly.
5. From profiles to actions
This section shows how to turn named profiles into actions with a clear goal, a measurable result and a fair test.
A profile is finished only when someone does something differently because of it. The simplest way to make that happen is to write, for each profile, one line that links the group to a business goal, an action and a metric. Table 4 does this for the four clusters of Table 3.
Three habits make the difference between a plan like Table 4 and a real improvement. The first is to hold out a control group: in every profile, randomly keep a small share of customers out of the campaign, so the effect of the action can be separated from what would have happened anyway. At-risk customers, for example, return on their own at some rate, and a campaign deserves credit only for the difference. The second is to match the cost of the action to the value of the group. Champions contribute 79.7% of revenue in the simulation, so personal attention is affordable; the 712 Dormant customers contribute 2.7%, so any action there must be cheap. The third is to use the soft view for timing. The customers sitting between Champions and At risk in the mixture model are a natural list for an early, gentle check-in, before they slide fully into the At-risk group and a stronger (and more expensive) incentive is needed.
Finally, an action plan closes the loop of Figure 1. After each campaign, rerun the features and the clustering, compare how many customers moved between profiles and update both the profiles and the plan.
6. Ten applications across industries
This section shows that the same way of thinking works far beyond marketing. Each of the ten applications follows the same frame: context, approach and action. Table 5 at the end of the section brings them together for comparison.
6.1. Marketing: segmenting customers for personalization
Context: an e-commerce marketplace wants to get more out of its advertising budget. Approach: collect purchase features such as R, F and M together with browsing behavior; use K-Means to divide customers into five clusters; profile them as "champions" (frequent, high spending), "loyal" (steady buyers), "promising" (recent, fairly high spending), "at risk" (no purchase for a while) and "dormant" (no purchase for a long time). Action: focus the retention budget on champions and loyal customers, run reactivation campaigns for the at-risk group and cut spending on the dormant group.
6.2. Cybersecurity: detecting abnormal behavior
Context: a company wants to protect its internal network from attacks and from data leaks by insiders. Approach: collect network access logs for each employee: login and logout times, volumes uploaded and downloaded, the servers usually accessed; build a profile of "normal" behavior for each person from 30 days of data; compare current behavior with that profile continuously. Action: if an accountant who normally works office hours suddenly logs in at 2 a.m. and downloads large volumes from the design server, the system alerts the security team immediately.
6.3. Human resources: predicting employee turnover risk
Context: a technology company wants to retain talent proactively. Approach: analyze data on employees who left over the past two years to build a profile of high turnover risk: no promotion for a long time, falling performance ratings, little participation in training, a long commute; apply the profile to current employees to predict a risk score. Action: HR starts conversations with people at high risk, learns about their difficulties and offers suitable solutions before it is too late. This application requires particular transparency toward employees (Section 7).
6.4. Healthcare: stratifying patient risk
Context: a hospital wants to improve care for patients with diabetes. Approach: use de-identified clinical data: blood glucose (HbA1c), blood pressure, cholesterol, age, medical history and number of emergency admissions; cluster patients into "low risk" (well controlled), "medium risk" (needs monitoring) and "high risk" (prone to complications). Action: give more resources to the high-risk group (reminder calls, more frequent follow-up visits) and a more automated care model to the low-risk group.
6.5. Supply chain: optimizing inventory
Context: a retail chain wants to cut inventory costs without hurting sales. Approach: profile each stock-keeping unit (SKU) by sales velocity, seasonality and sensitivity to promotions; profiles might be "steady fast sellers", "seasonal fast sellers" and "slow movers". Action: keep deep stock of steady fast sellers, stock seasonal items only ahead of their peak and order slow movers on demand (just in time).
6.6. Banking: credit scoring with alternative data
Context: a bank wants faster and more accurate lending decisions, especially for young people and freelancers whose credit bureau files are too thin to judge. Approach: alongside the bureau score, collect (with the customer's consent) alternative data: bank transaction history, stability of incoming cash flow, payment history for utility and phone bills; cluster customers with similar financial patterns; build profiles such as "stable salaried employee" (regular income, planned spending), "project-based freelancer" (large but irregular income) and "recent graduate" (low income, no savings yet). Action: instead of a flat rejection, offer each profile a suitable product: a standard loan for stable employees, a flexible loan for freelancers and a small-limit credit card that lets graduates start building a credit history.
6.7. Manufacturing: predictive maintenance
Context: a factory wants to reduce unplanned downtime, which is very costly for every hour a production line stands still. Approach: attach sensors to critical parts to record temperature, vibration, pressure and rotation speed in real time; build a "healthy operation" profile for each machine type; compare incoming data with that profile continuously. Action: when the vibration and temperature of a machine start to drift from its profile, the system raises an alert and creates a maintenance ticket; engineers replace a failing bearing during planned maintenance instead of waiting for a breakdown.
6.8. Insurance: detecting fraudulent claims
Context: a motor insurer sees the rate of fraudulent claims rising. Approach: study confirmed fraud cases to build a profile of a suspicious claim: filed very soon after the policy was bought, an accident in a remote place with no witnesses, damage out of proportion to the scene, garages or clinics with a questionable history. Action: score each new claim by its similarity to that profile; high-scoring claims are not approved automatically but go to the investigation unit.
6.9. Telecommunications: managing mobile network quality
Context: a mobile operator wants to improve user experience and use its cell towers efficiently. Approach: analyze tower data on user density, data traffic and dropped-call rates by hour and by day; build area profiles such as "office district" (peak 9 a.m. to 5 p.m. on weekdays), "residential" (peak in the evening and at weekends) and "stadium or event venue" (short, sudden peaks). Action: add capacity to office districts by day and residential areas by evening, and send mobile cell units to stadiums on event days to prevent congestion.
6.10. Video games: personalizing the experience
Context: a mobile game studio wants more players to return and to spend voluntarily in the game. Approach: track playing time, levels replayed, items used, favorite features and the points where players tend to quit; cluster players into profiles such as "whales" (very high spending), "explorers" (love discovering new areas), "competitors" (focused on ranked matches) and "socializers" (spend much of their time in chat and guilds). Action: notify explorers about new areas, competitors about upcoming tournaments and socializers about guilds that are recruiting; with the high-spending group, take particular care (Section 7).
Table 5 brings the ten applications together.
The last column of Table 5 reveals a pattern. When the entity is a machine, a product or a cell tower, profiling carries almost no ethical risk. When the entity is a person, and especially when the result leads to a decision about that person, the risk rises quickly. That is the subject of the final section.
7. Pitfalls to avoid
This section lists six common pitfalls and then looks more closely at the two that matter most. Profiling is not a destination but an ongoing effort to understand, and its power comes with responsibility. Table 6 summarizes the pitfalls.
Respect privacy and the law. Profiling is processing of personal data, and most modern data protection laws treat it explicitly. The European Union's General Data Protection Regulation (GDPR) defines profiling as automated processing of personal data to evaluate personal aspects of a person, such as their economic situation, preferences, behavior or reliability (European Parliament & Council of the European Union, 2016, Article 4). Several principles from the GDPR have become a common reference point well beyond Europe. Tell people the purpose of the processing and have a lawful basis for it. Collect only the data the purpose needs. Give special protection to sensitive categories such as health and biometric data, and treat financial data with comparable care. Under Article 21, people can object at any time to profiling for direct marketing. Under Article 22, people have the right not to be subject to a decision based solely on automated processing, including profiling, when it produces legal or similarly significant effects, such as the automatic refusal of a loan. For employees, monitoring network behavior or predicting turnover should be announced clearly and used to support people, not to punish them.
Be careful with vulnerable groups. A "whale" profile in a game or a "bargain hunter" profile in e-commerce can be used to exploit people who find it hard to control their spending, including minors. A simple test helps: would customers be comfortable if they knew they had been profiled this way and were being treated like this? If the answer is no, the profile is being misused. The same caution applies when a profile infers personal traits that people never disclosed, such as health status or financial difficulty, from their behavior.
Conclusion
Profiling is one of the simplest and most effective ways to turn data into understanding. By combining business thinking with analytical tools that range from a table of medians and a set of RFM features to K-Means and a soft mixture model, an analyst can turn lifeless numbers into portraits a team can act on, such as the four customer groups in Table 3 or the ten profiles in Table 5. The decisive step is not the algorithm but the last one: naming the groups honestly, linking each to a goal and an action and measuring whether the action worked.
A portrait, however, is always a simplification. It goes out of date when people change, it is wrong when the data are wrong and it causes harm when it is used to decide about people who do not know about it and cannot challenge it. Good profiling therefore needs more than good technique. It needs a clear answer to three questions: what the profile is for, whom it serves and whether the people profiled are treated with respect.
Approached with method and responsibility, profiling stops being just an analytical tool and becomes a compass that helps an organization understand its customers, its employees and its own operations better.
References
European Parliament & Council of the European Union. (2016). Regulation (EU) 2016/679 of the European Parliament and of the Council of 27 April 2016 on the protection of natural persons with regard to the processing of personal data and on the free movement of such data (General Data Protection Regulation). Official Journal of the European Union, L 119. https://eur-lex.europa.eu/eli/reg/2016/679/oj
Hughes, A. M. (1994). Strategic database marketing. Probus. https://www.amazon.com/s?k=Strategic+database+marketing+Hughes&i=stripbooks
Provost, F., & Fawcett, T. (2013). Data science for business: What you need to know about data mining and data-analytic thinking. O'Reilly Media. https://www.oreilly.com/library/view/data-science-for/9781449374273/
Rousseeuw, P. J. (1987). Silhouettes: A graphical aid to the interpretation and validation of cluster analysis. Journal of Computational and Applied Mathematics, 20, 53–65. https://doi.org/10.1016/0377-0427(87)90125-790125-7)
Discussion about this post