Asking the Right Analytics Question
Narrow a vague business problem through four layers until it becomes a calculation on real data columns, tied to a decision


Key takeaways
Every analytics question has an owner: the person who will use the answer to decide. Without one, you have a topic, not a question.
A four-layer funnel takes a business problem down to a business question, an analytics question and finally a statistical question that names real columns.
Anchor the funnel to a decision question and write the expected action in advance: "if the metric is above the threshold, do A; otherwise, do B."
Each type of analysis has a mandatory part: diagnosis needs a benchmark, prediction needs an unobserved value, prescription needs both an objective and constraints.
Classify questions by what the answer produces, not by keywords, and write everything on a one-page design sheet that includes an ethics check.
For years, Google was famous for brain-teaser interview questions such as "how many golf balls fit in a school bus?" and for valuing university grade point averages when hiring. The unspoken belief was that people who solved the puzzles and had high grades would perform well. When the people-analytics team finally asked a very simple question, do these things predict success on the job?, and analyzed data from tens of thousands of interviews, the answer was no. Google dropped the brain teasers and moved to structured behavioral interviews (Richardson & Watson, 2024). No new algorithm was involved; what changed the decision was a well-posed question aimed at a belief nobody had ever tested.
The journey from data to insight therefore starts not with data but with a question, and good questions are usually more specific than we think. A wrong or vague question leads to collecting the wrong data, choosing the wrong technique and reporting conclusions that do not solve the real problem. A sufficiently narrow question, by contrast, pins down exactly the data needed and greatly shortens the road to an answer.
This article has five sections. Section 1 discusses who owns an analytics question. Section 2 sets out six characteristics of a good question. Section 3 presents a four-layer funnel from business problem to statistical question. Section 4 attaches a purpose to the question and shows how to classify questions that are easily confused. Section 5 brings everything together in a one-page question design sheet.
1. Every question has an owner
Specifying the question is the first step of the SOAR analytics model. Before discussing what a good question looks like, one point governs everything that follows: every analytics question has an owner, the person who will use the answer to make a decision, and the level of that person sets the level of the question.
With the same accounting data, a chief financial officer asks "how does this quarter's profit margin compare with plan?", an auditor asks "which large transactions lack approval?", and a tax specialist asks "why is the gap between accounting profit and taxable income widening?" (Richardson & Watson, 2024). Three questions, three decision makers, three governing standards. An analyst who receives a question without knowing whose it is does not yet have a question; they have a topic.
2. Six characteristics of a good question
Not every question is suited to analysis with data. Table 1 lists six characteristics that a good analytics question usually has, with examples that pass and fail.
The six characteristics in Table 1 are not a rigid checklist but a set of criteria for review: before starting the analysis, check the question against each one and refine it if needed. The first criterion, "specific", demands more than we think, and the next section shows why.
3. A four-layer funnel: from problem to statistical question
In practice, managers rarely hand analysts a perfect question. They usually state a broad, vague problem, such as "profits are falling" or "customers are leaving us", and the analyst's job is to narrow it step by step into a question that data can answer. This section presents the narrowing tool and two important additions.
3.1. Four layers, four tests
The narrowing works like a four-layer funnel, as in Figure 1. The running example is a hypothetical restaurant chain with branches in several cities.
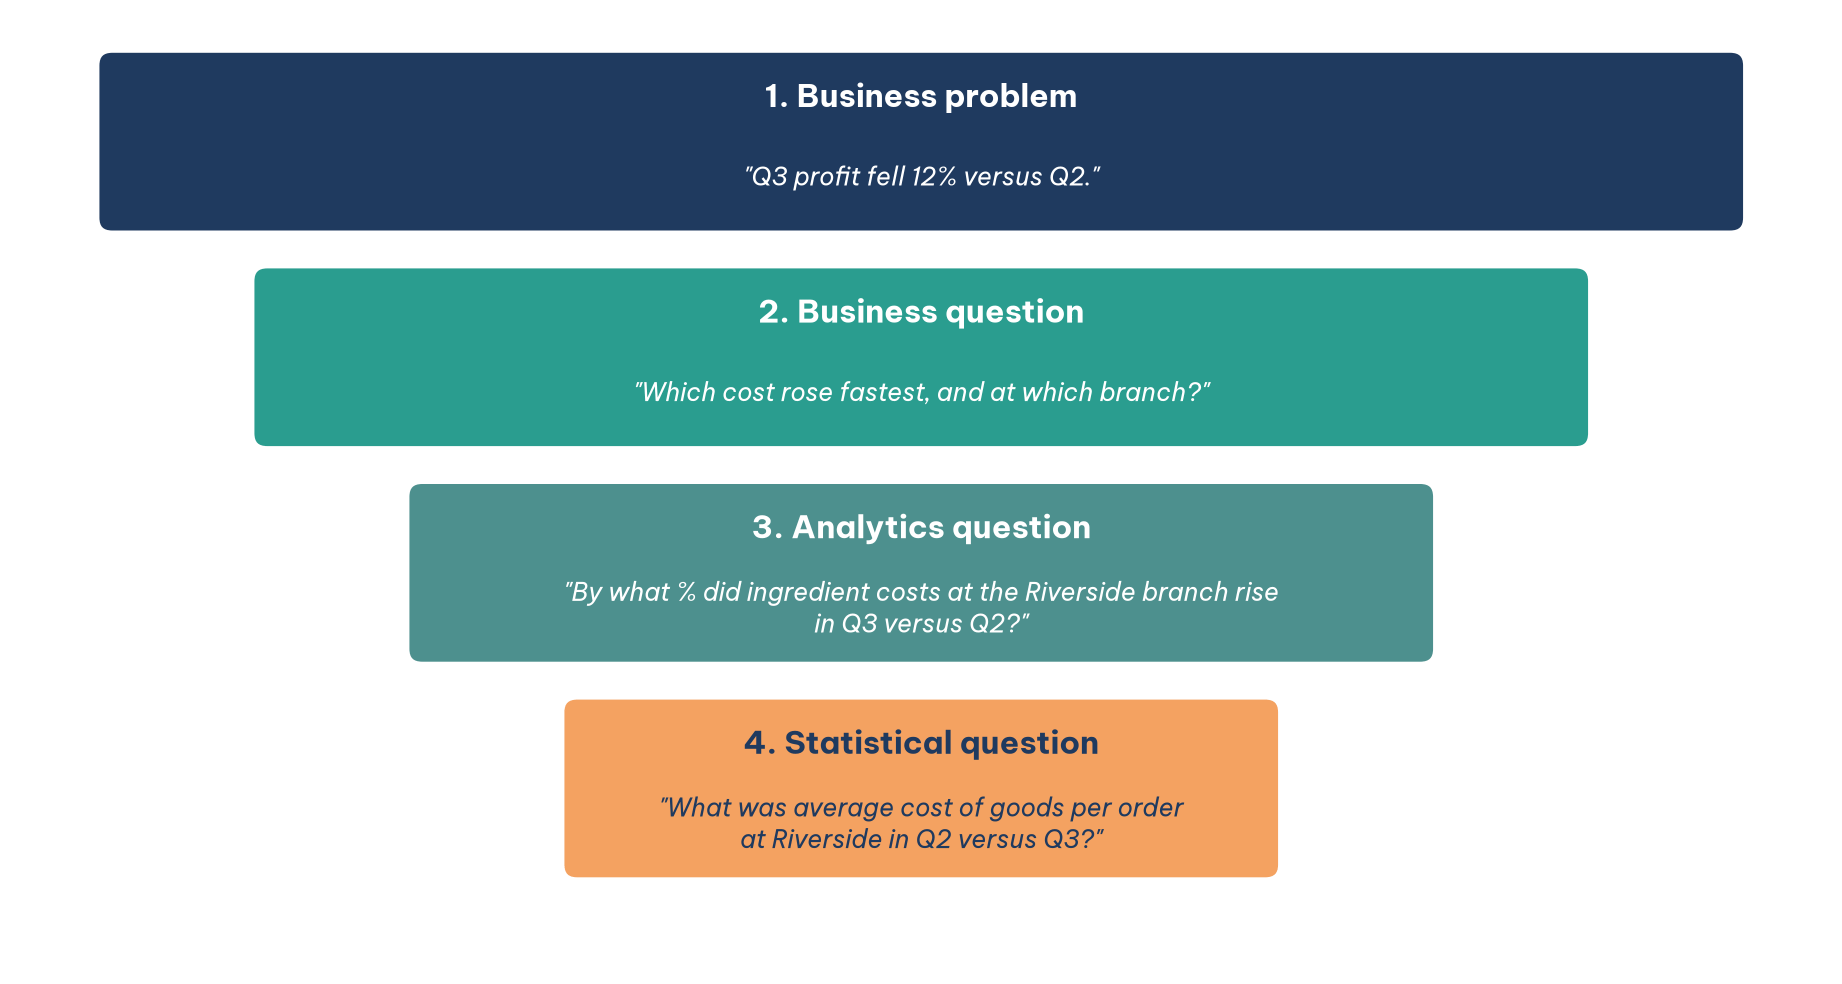
Each layer in Figure 1 has a defining feature and a test for whether it has been written fully, as Table 2 summarizes.
Three points about the layers are often missed. First, layer 1 is a fact with numbers, not a complaint: "profits are falling" is not yet layer 1; "Q3 profit fell 12% versus Q2" is. Second, layer 4 is a feasibility test: if you cannot write the statistical question using column names that actually exist in the data, the question cannot yet be answered with the data at hand. Third, the type of analysis is not a layer but a property of the whole chain from layer 2 to layer 4, as Section 4 explains.
3.2. The decision question and the expected action
The funnel needs a destination, and that destination is the decision question, written in one sentence following the pattern "[who] needs to decide [what] by [when], based on [which metric], within [which constraints]". For example: "The manager of the Riverside branch needs to decide whether to switch ingredient suppliers before the January ordering cycle, based on cost of goods per order, within the constraint that the current contract has three months left." A business question that does not serve this decision, however interesting, should be saved for another project. The short principle is start from the decision, not from the data.
For each business question, it helps to write an expected action in advance, in the form "if [metric] is [above or below] [threshold], then [action A]; otherwise [action B]." For example: "If cost of goods per order at the Riverside branch rose more than 8% while other branches rose less than 3%, renegotiate or switch suppliers; otherwise treat it as a general rise in ingredient prices and review menu prices." This line tests the action-oriented criterion, because if both outcomes lead to the same action the question is not worth answering; it forces the requester to state the threshold they are silently using; and it shapes the recommendation in advance.
3.3. Two traps when writing questions
The first trap is a question that carries its own hypothesis. Problems often reach the analyst together with the requester's explanation: "revenue is down, probably because of a competitor's promotion." Writing that hypothesis straight into the question, "how much did the competitor's promotion reduce our revenue?", lets confirmation bias choose the direction of the search from the start: the team will look for data on the competitor and will find it. The layer-2 question should leave the cause open, and the requester's hypothesis should be recorded separately as one of several hypotheses to test.
The second trap is a survey question that frames the answer. When a question is asked directly of customers or employees, its wording partly decides the answer. In a classic experiment, the same treatment outcomes presented as "survival rates" or as "mortality rates" changed the share of people choosing surgery considerably (McNeil et al., 1982). The survey item "How satisfied are you with our fast delivery?" has already planted the word "fast".
4. Attaching a purpose to the question
The question at the bottom of the funnel is much sharper, but one dimension still has to be settled: what do we want to know, or decide? This section classifies questions by purpose and offers a way to classify questions that are easily confused.
4.1. The mandatory part of each type of question
Each type of analysis has a mandatory part at the question-writing stage, without which the question is not yet adequate (Richardson & Watson, 2024). A diagnostic question always stands next to a benchmark: "why did revenue fall?" is not yet askable; "why was Q3 revenue 8% below plan while the industry grew 2%?" is. A predictive question must state the unobserved value to be estimated and when it is needed, such as the probability that a customer churns within 90 days. A prescriptive question must state both the objective and the constraints: without constraints it has a trivial answer (for the fastest delivery, choose the most expensive carrier); without an objective it has no answer.
It is also important not to tie the type of analysis to the object, as in "orders are a job for predictive analytics." The same object can be the subject of all four types, depending on what we want to do with the information about it. Table 3 illustrates this with a delivery system.
The last column of Table 3 is a reminder that each type has an output true to its nature and a limit that comes with it: a descriptive report may not conclude about causes, and a predictive model does not by itself say what to do. Stating the expected output when the question is written helps avoid reading results beyond what the analysis allows.
4.2. Three questions for classification
The most common error is classifying by keywords: seeing "why" and calling it diagnostic, seeing "will" and calling it predictive. A more reliable way is to ask about what the answer produces, in the order shown in Figure 2.
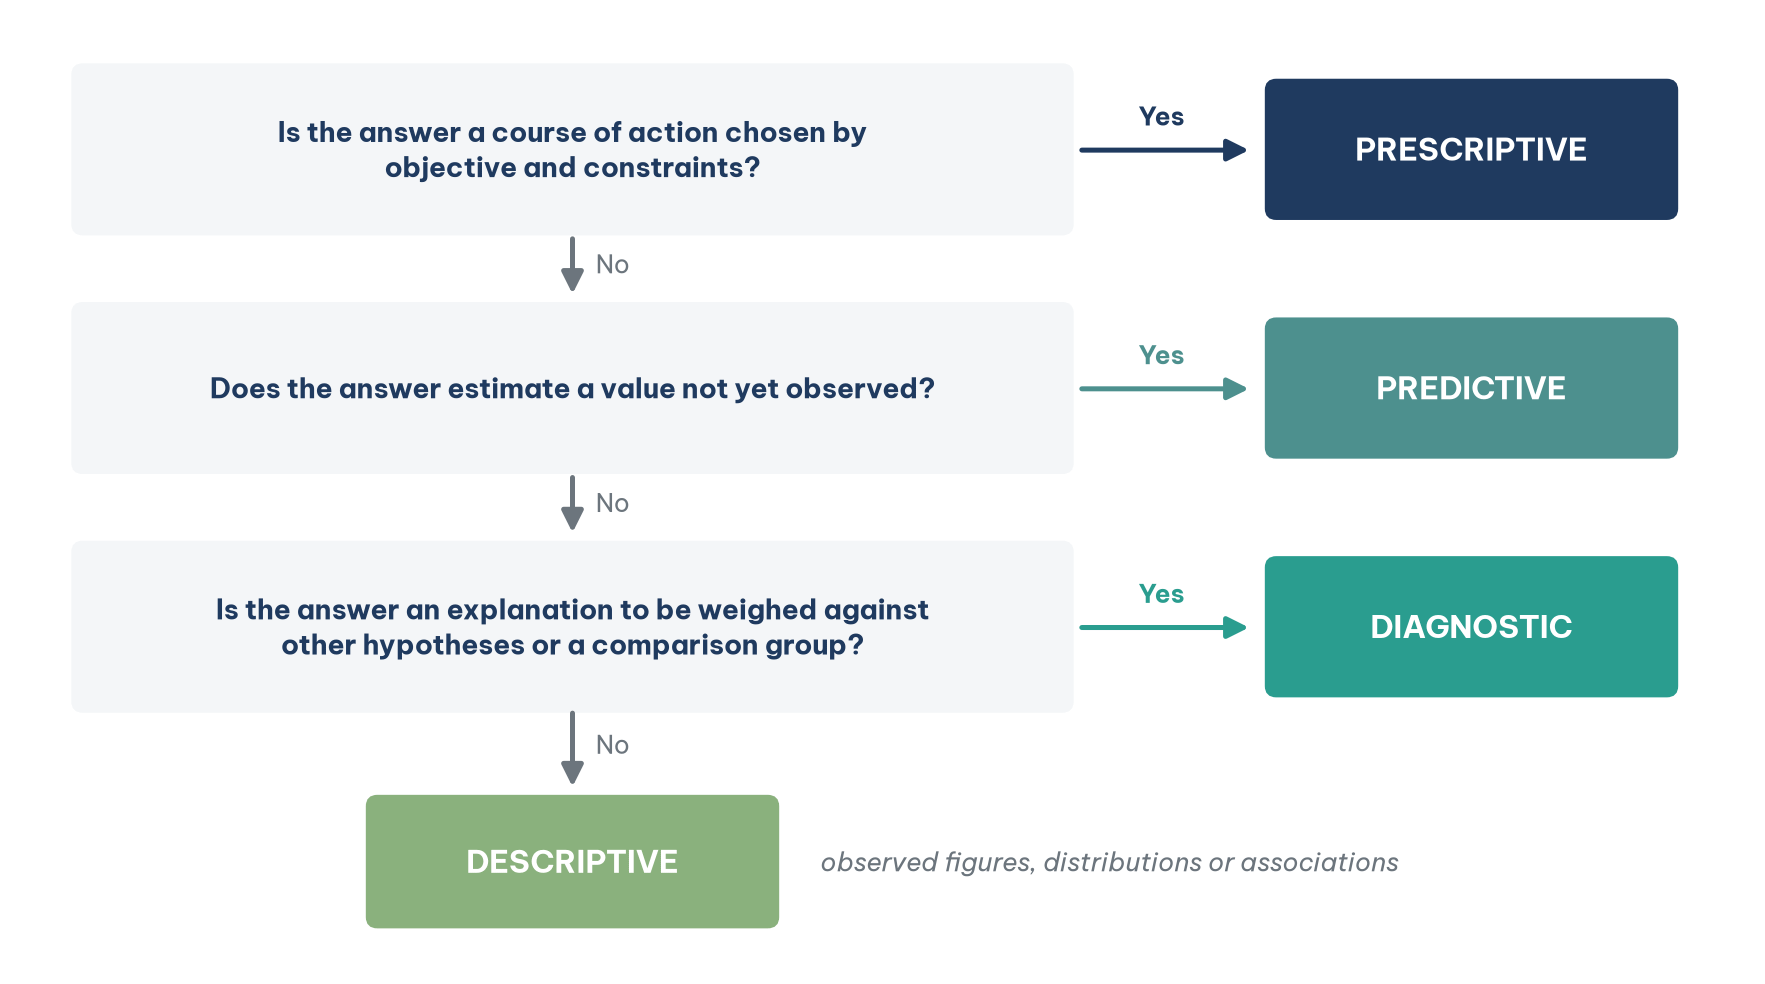
The order in Figure 2 has a reason. Prescription is checked first because a prescriptive question usually contains prediction and description inside it; checking prediction first would misclassify "how much stock should we order?" as predictive merely because it needs a demand forecast. Prediction is checked before diagnosis because the real boundary between them is whether the value we want to know has been observed. And a question is diagnostic only when the answer is an explanation that must be weighed against other hypotheses or against a comparison group. A few quick readings: "Why was Q3 revenue higher than Q2?" may need only a comparison table by product, which is descriptive; "Does weather affect sales?" is diagnostic, while the corresponding descriptive question is "how different are sales on rainy and sunny days?"; and "Does the coupon program have a positive ROI?" becomes a causal diagnosis only when compared with a group that did not receive coupons.
5. The analytics question design sheet
The dimensions just discussed work only when they are written down. A question that lives in the analyst's head always seems clear; only when it is written line by line do vague spots, such as the denominator of a metric or the level of a conclusion, come to light. The sheet below gathers eleven lines to settle on a single page, and it is the first document to send to the requester for confirmation before looking for data.
Decision question: [who] needs to decide [what] by [when], based on [which metric], within [which constraints]?
Question chain: business problem with figures and source, business question, analytics question, statistical question.
The business system under study and the expected data sources.
The entities, set of entities or events the question is about.
Unit of observation (what one row of data is), level of conclusion and level of decision.
Time and geographic scope.
Key variables and metrics, with the role of each; for each metric, state the numerator, the denominator and exclusions.
Type of analysis and expected output.
Success criteria and expected action.
Expected limits: how far conclusions may go.
Ethics check: does the data invade privacy, has consent been given for this purpose, and could the answer be used to harm anyone?
Line 11 is there because a question can be ethically wrong before it is technically wrong. Amazon once sought a patent for a wristband that tracked the hand movements of warehouse workers to answer the question "who picks slowly and why", an entirely valid analytical question that nonetheless imposed a level of surveillance many found unacceptable (Richardson & Watson, 2024). At the question stage, the analyst's job is to raise such concerns early, while changing the question is still cheap. The sheet is also a tool for reviewing questions proposed by others, or by AI: a question that cannot fill line 5 or line 7 is not ready for data collection, however good it sounds.
Conclusion
Google's interview puzzles show that the greatest value of analytics sometimes lies in aiming one well-posed question at a belief nobody has tested. Asking the right question is a learnable skill: knowing who owns the question, reviewing it against six characteristics, narrowing it through the four-layer funnel until it can be written as a calculation on real data columns, and anchoring it to a decision question with two courses of action.
The purpose dimension completes the question. Each type of analysis has a mandatory part, the same object can serve four purposes, and the reliable way to classify a question is by what its answer produces, not by keywords. Writing everything on a one-page sheet, including the ethics check, is the cheapest way to discover that a question is not ready before spending effort finding data for it.
References
McNeil, B. J., Pauker, S. G., Sox, H. C., Jr., & Tversky, A. (1982). On the elicitation of preferences for alternative therapies. New England Journal of Medicine, 306(21), 1259–1262. https://doi.org/10.1056/NEJM198205273062103
Richardson, V. J., & Watson, M. W. (2024). Introduction to business analytics. McGraw Hill. https://www.mheducation.com/highered/product/introduction-business-analytics-richardson-watson/9781265450175.html
Discussion about this post